
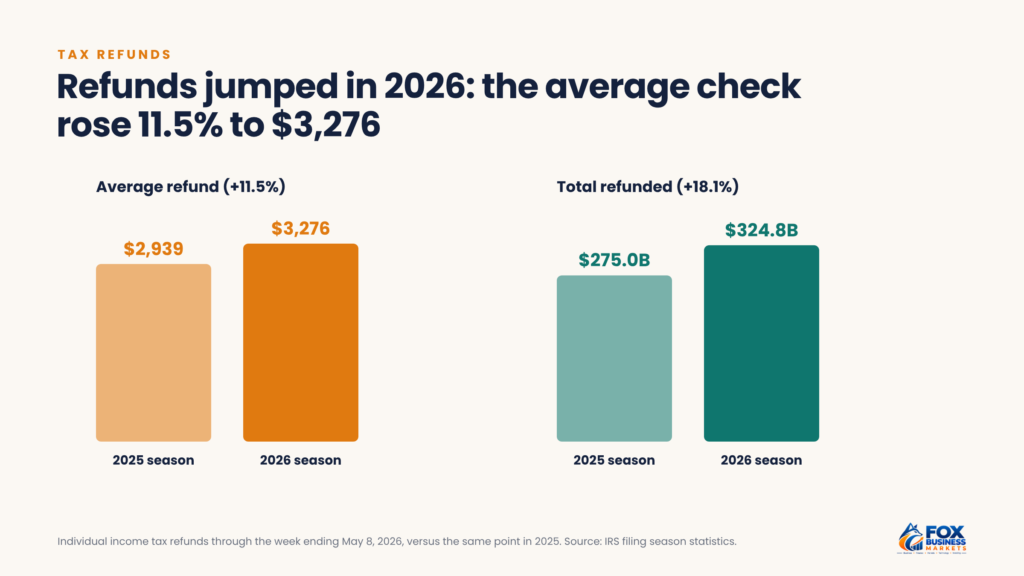
Quick answer: The federal government collected $5.4 trillion in fiscal 2026, and individual income taxes supplied $2.84 trillion of it, about 53%. Federal income tax is highly concentrated: the top 1% of earners paid 38.4% of it in 2023. Refunds also grew, with the average reaching $3,276 in the 2026 filing season, up 11.5%.
Federal tax revenue rose 3% in fiscal 2026, which ended Sept. 30, but Washington still spent about $2 trillion more than it collected, according to the Congressional Budget Office.
Most of that money comes from ordinary paychecks, yet the burden is spread very unevenly. The top 1% of earners pay more federal income tax than the bottom 90% combined, while about 40% of households owe none after credits. Refunds also grew, while the IRS lost nearly a fifth of its staff.
This roundup collects the latest tax statistics for 2026 from the CBO, the IRS, and independent researchers: where federal revenue comes from, who pays, refund and filing trends, the tax gap, and how U.S. taxes compare with other countries.
Key Tax Statistics for 2026
- $5.40 trillion in total federal revenue in fiscal 2026. (CBO)
- 53% of federal revenue came from individual income taxes. (CBO)
- $3,276 was the average refund in the 2026 filing season, up 11.5% from 2025. (IRS)
- 53 million filers claimed at least one of the new deductions for seniors, overtime, or tips by Tax Day 2026. (Treasury)
- 97% of individual returns were filed electronically in the 2026 season. (IRS)
- 4% of federal income taxes were paid by the top 1% of earners in 2023. (Tax Foundation, IRS data)
- 40% of households will owe no federal income tax for 2025. (Tax Policy Center)
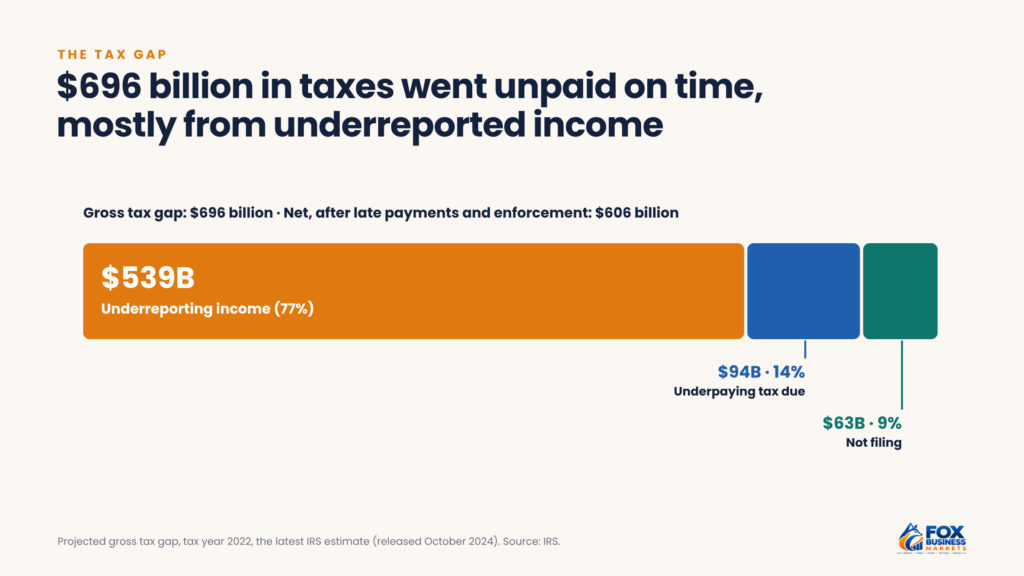
- $696 billion in taxes owed went unpaid on time in 2022, the latest IRS tax gap projection. (IRS)
- $544.6 billion is the estimated cost of complying with IRS filing rules in 2026. (Tax Foundation)
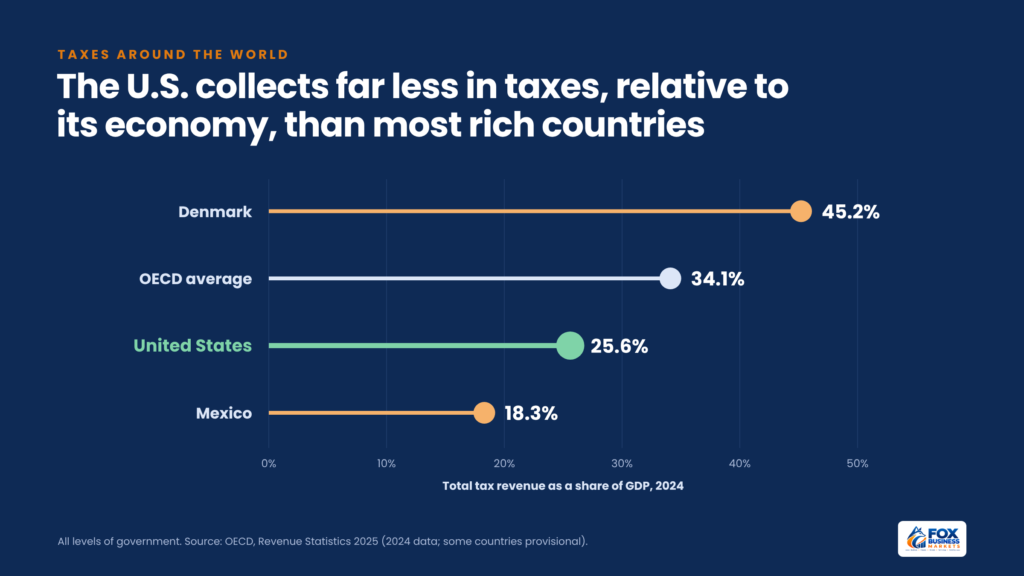
- 6% of GDP is collected in taxes in the U.S., versus an OECD average of 34.1%. (OECD)
Where Does Federal Tax Revenue Come From?
Individual income and payroll taxes, paid by workers and their employers, supply the vast majority of federal revenue. CBO’s figures for fiscal 2026:
Source | FY2026 revenue | Change from FY2025 |
| Individual income taxes | $2.84 trillion | Up 7% |
| Payroll taxes | $1.82 trillion | Up 4% |
| Corporate income taxes | $382 billion | Down 16% |
| Other receipts | $190 billion | Up 3% |
| Customs duties | $172 billion | Down 11% |
| Total | $5.40 trillion | Up 3% |
Individual income taxes made up 53% of the total and payroll taxes 34%. The federal deficit for fiscal 2026 was about $1.99 trillion, $218 billion larger than in fiscal 2025.
Why customs duties fell. Tariff collections were high early in the fiscal year but fell after May 2026, when the government began refunding tariffs imposed under the International Emergency Economic Powers Act following a February 2026 Supreme Court ruling. CBO estimates about $130 billion was refunded in fiscal 2026.
Why corporate taxes fell. CBO attributes the drop to the One Big Beautiful Bill Act, which lets companies deduct certain investments faster. The federal corporate tax rate has been a flat 21% since 2018, and many businesses, including most partnerships, S corporations, and sole proprietorships, don’t pay corporate income tax at all. Their profits pass through to owners’ individual returns, one reason individual income taxes make up such a large share of revenue.
Who Pays Federal Income Taxes?
Federal income tax is highly progressive. According to a Tax Foundation analysis of IRS data for tax year 2023, the latest available:
Group | Income needed to qualify (AGI) | Share of income | Share of federal income taxes | Average tax rate |
| Top 1% | $675,602 | 20.6% | 38.4% | 26.3% |
| Top 5% | $272,209 | 36.4% | 59.3% | 23.0% |
| Top 10% | $187,608 | 47.6% | 70.5% | 20.9% |
| Top 50% | $53,801 | 87.7% | 96.7% | 15.6% |
| Bottom 50% | Below $53,801 | 12.3% | 3.3% | 3.7% |
| All taxpayers | — | 100% | 100% | 14.1% |
Taxpayers filed 153.1 million returns for 2023 and paid about $2.1 trillion in individual income taxes. The top 1%’s share fell from 40.4% in 2022 as its share of income dropped. The bottom 90% paid 29.5% of the total, less than the top 1% alone.
Average rates sit far below the top tax bracket rates because each rate applies only to part of a filer’s income, and deductions and credits shrink the bill further.
Is It True That Nearly Half of Americans Pay No Income Tax?
Closer to 40%. The Tax Policy Center estimates that 40% of households, about 76 million, will owe no federal individual income tax for 2025. About 70% of them earn under $75,000, and many are families with children or older adults on fixed incomes whose credits and deductions erase their bill. That estimate predates some of the new 2025 deductions, which could push the share higher.
That doesn’t mean they pay no tax. Most still pay payroll taxes of 7.65% on every paycheck for Social Security and Medicare, plus sales and property taxes. For many lower- and middle-income workers, payroll taxes are larger than their income taxes. Our guide on how taxes work explains how the different taxes fit together.
How Much Do Americans Get Back in Tax Refunds?
Refunds grew sharply in 2026. Through May 8, 2026, according to IRS filing season statistics:
| 2025 season | 2026 season | Change | |
| Returns received | 145.9 million | 145.0 million | -0.6% |
| Refunds issued | 93.6 million | 99.1 million | +6.0% |
| Total refunded | $275.0 billion | $324.8 billion | +18.1% |
| Average refund | $2,939 | $3,276 | +11.5% |
Over a full fiscal year, the numbers are bigger. The IRS issued 120.6 million refunds totaling $638.8 billion in fiscal 2025, including 116.9 million individual income tax refunds worth $516.4 billion, according to its 2025 Data Book. Of those, 22.2 million included the earned income tax credit.
How Many People Claimed the New Tax Breaks?
The One Big Beautiful Bill Act added several temporary deductions that applied to 2025 income, while most workers’ withholding stayed the same. Treasury tied part of the 2026 refund jump to them. By Tax Day 2026, according to a Treasury official cited by the Associated Press:
- More than 53 million filers had claimed at least one new deduction.
- 30 million older Americans claimed the enhanced senior deduction.
- 21 million claimed the overtime deduction.
- 6 million claimed the deduction for tips.
Itemizing, meanwhile, remains rare. Fewer than one in 10 returns, 9%, claimed itemized deductions in tax year 2023, according to the Congressional Research Service, down from 30.6% in 2017, according to USAFacts. The share rises steeply with income, from 2% of returns under $50,000 to 83% of returns above $5 million. Our comparison of the standard deduction vs. itemized deductions shows who comes out ahead.
How Do Americans File Their Taxes?
Electronic filing is now nearly universal for individuals:
- 97% of the 145 million individual returns received through May 8, 2026, were e-filed.
- 7 million e-filed returns were self-prepared, up 1.7% from 2025.
- 3 million e-filed returns came through tax professionals.
- 7% of individual returns were filed electronically across all of fiscal 2025, per the IRS Data Book.
The IRS processed 271.4 million returns and other forms in fiscal 2025, including 162.8 million individual income tax returns, and collected more than $5.3 trillion in fiscal 2025. With Direct File discontinued for the 2026 season, our guide on how to file taxes covers today’s free and paid options.
How Much Does It Cost to Comply With the Tax Code?
Filing taxes takes real time and money. The Tax Foundation estimates that Americans will spend about 6.9 billion hours complying with IRS filing and reporting requirements in 2026, at a total cost of about $544.6 billion, more than 1.7% of GDP. That includes about $387.5 billion in lost productivity and $157.1 billion in out-of-pocket costs for software, preparers, and other expenses.
Businesses carry much of that burden, but individuals feel it too, especially those with self-employment income, investments, or rental property.
How Big Is the Tax Gap?
The tax gap is the difference between the taxes people and businesses owe and what they pay on time. The IRS’s latest projection, released in October 2024, covers tax year 2022; an update scheduled for 2025 has been delayed:
- $696 billion gross tax gap, taxes owed but not paid on time.
- $606 billion net tax gap, after late payments and IRS enforcement recover about $90 billion.
- 85% voluntary compliance rate: the share of taxes paid voluntarily and on time.
Most of the gap comes from people and businesses underreporting income:
Source of the gap | Amount | Share |
| Underreporting income | $539 billion | 77% |
| Underpaying tax shown on returns | $94 billion | 14% |
| Not filing at all | $63 billion | 9% |
Compliance is highest for wages, where employers report income and withhold tax, and lowest for business and self-employment income that isn’t reported to the IRS by a third party.
How Is the IRS Changing?
The IRS is getting smaller. Employees in pay status fell to 80,967 at the end of fiscal 2025, from 99,628 a year earlier, according to the IRS’s 2025 Data Book.
Enforcement activity in fiscal 2025:
- 497,621 audits closed, recommending $26.8 billion in additional tax.
- 987,460 automated underreporter cases closed, which flag income missing from returns, resulting in $5.9 billion in additional assessments.
- More than 120,000 fewer audits were opened in 2025 than in 2024, according to the Taxpayer Advocate Service, as reported by Reuters.
The effect of a smaller IRS on compliance won’t show up in tax gap estimates for several years.
How Do State and Local Taxes Compare?
State and local taxes vary widely:
- Nine states don’t tax wages: Alaska, Florida, Nevada, New Hampshire, South Dakota, Tennessee, Texas, Washington, and Wyoming. Washington does tax some large capital gains.
- Five states have no statewide sales tax: Alaska, Delaware, Montana, New Hampshire, and Oregon.
- 53% was the population-weighted average combined state and local sales tax rate as of July 1, 2026, according to the Tax Foundation.
- 13% in Louisiana was the highest average combined sales tax rate, followed by Tennessee (9.61%), Washington (9.57%), Arkansas (9.48%), and Alabama (9.46%).
A state without an income tax often relies more heavily on sales or property taxes, so the total burden can be closer than the headline suggests.
Does the U.S. Have High Taxes Compared With Other Countries?
No. By the most common international measure, total taxes as a share of the economy, the U.S. ranks near the bottom of developed countries. U.S. taxes at all levels of government equaled about 25.6% of GDP in 2024, compared with an average of 34.1% across OECD countries, according to the OECD’s Revenue Statistics 2025.
At the extremes, Denmark collected 45.2% of GDP in taxes, and Mexico 18.3%.
The comparison has limits. The U.S. has no national value-added tax, which many countries use heavily, and Americans pay privately for some services, such as much of their health insurance, that other countries fund through taxes. The U.S. also relies more on personal income taxes than the typical OECD country.
What Tax Changes Are Coming in 2027?
Several changes already set in law or announced will affect next year’s numbers:
- Social Security wage base: rises to $192,300 in 2027, from $184,500, according to the Social Security Administration’s Oct. 14, 2026, announcement. Workers above the old cap will pay nearly $484 more in Social Security tax.
- Inflation adjustments: the IRS is expected to release 2027 brackets and standard deductions in October or November.
- SALT cap: rises 1% to about $40,804 for 2027, under the One Big Beautiful Bill Act.
- Temporary deductions: the deductions for tips, overtime, car loan interest, and seniors continue through 2028.
The IRS’s weekly filing statistics resume in February 2027 and will show whether the 2026 jump in refunds continues.
Frequently Asked Questions
What are the odds of being audited by the IRS?
Low for most people. The IRS closed 497,621 audits in fiscal 2025, compared with about 162.8 million individual returns filed, and most IRS contacts are automated letters about mismatched income rather than full audits. Match every W-2 and 1099 to your return before filing, since mismatches trigger most IRS letters.
How many people claim the earned income tax credit?
The IRS issued 22.2 million refunds that included the earned income tax credit in fiscal 2025, according to its Data Book. The credit goes mainly to low- and moderate-income workers, especially those with children. If your income dropped this year, run the IRS EITC Assistant to see whether you qualify.
Which state has the highest income tax rate?
California has the highest top state income tax rate, at 13.3%, which applies to income above $1 million. Several other states, including Hawaii, New York, and New Jersey, have top rates above 10%. If you’re weighing a move, compare the total of income, sales, and property taxes, not just the income tax rate.
When will new tax statistics be released?
The IRS publishes weekly filing season statistics from February through May and its annual Data Book each June. CBO reports federal revenue monthly, and the IRS’s 2027 inflation adjustments usually arrive in October or November. Check the IRS filing season statistics in February to see how your refund compares as the season unfolds.
Use These Numbers to Plan Your Own Taxes
Compare your own return with these benchmarks. If your refund was well above the average, you may be overwithholding and could adjust your W-4; if you itemized, check whether you still beat the standard deduction under the 2026 rules. Our personal finance statistics roundup puts these tax figures alongside data on income, savings, and debt.
This article is for general information only and isn’t financial, tax, legal, or investment advice. Consider your own situation or talk to a qualified professional before making decisions.