
Revenue Growth Calculator: Find Your MoM, QoQ, and YoY Growth Rate
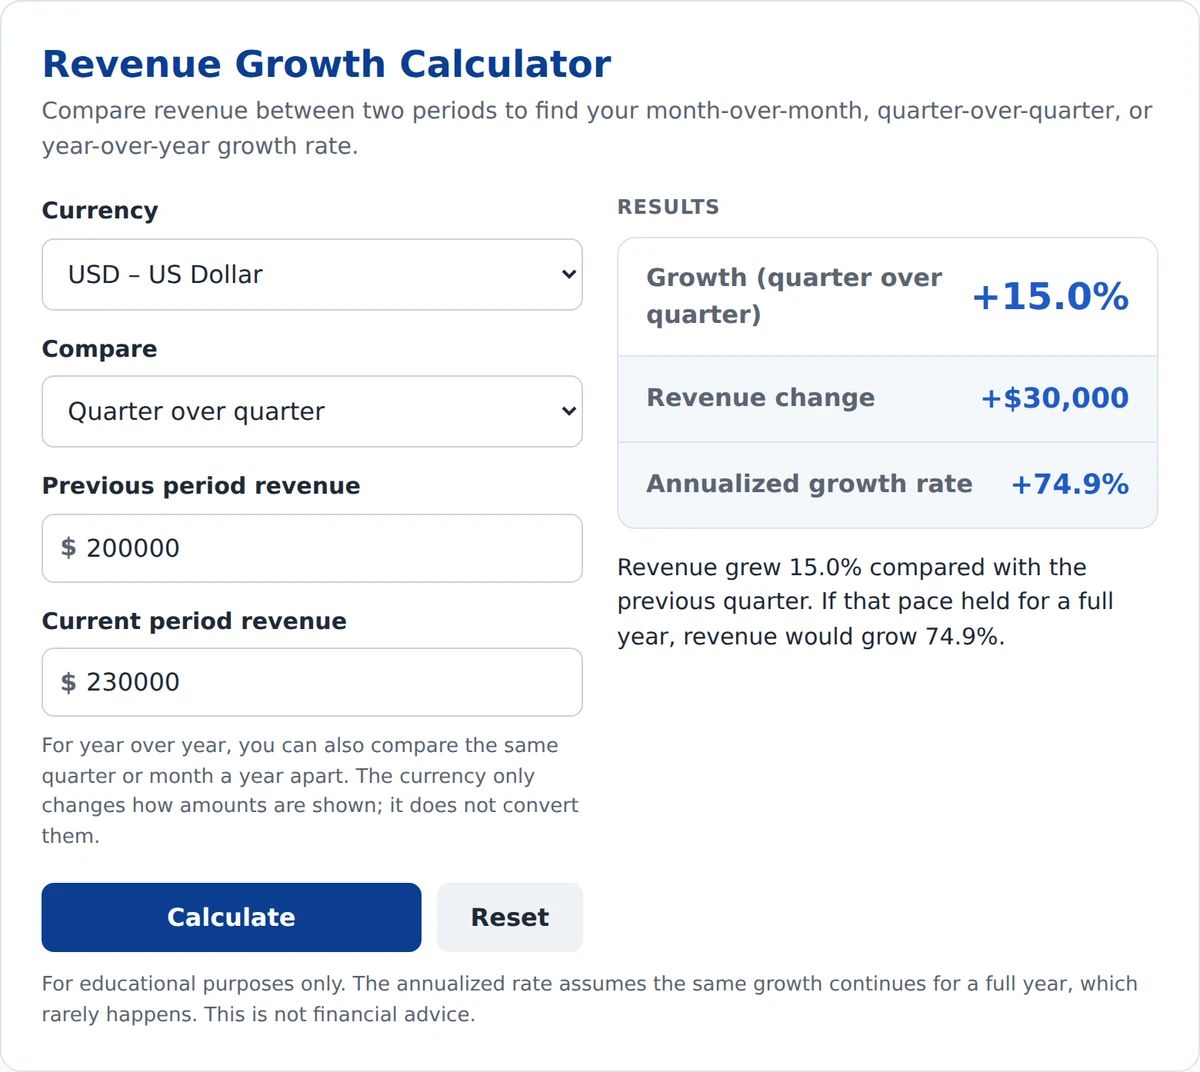
The Revenue Growth Calculator shows how much revenue grew or fell between two periods. Enter last period's revenue and this period's revenue, then choose month over month, quarter over quarter, or year over year. The calculator shows the growth rate, the dollar change, and what that pace would mean over a full year.
Compare revenue between two periods to find your month-over-month, quarter-over-quarter, or year-over-year growth rate.
For year over year, you can also compare the same quarter or month a year apart. The currency only changes how amounts are shown; it does not convert them.
Results
For educational purposes only. The annualized rate assumes the same growth continues for a full year, which rarely happens. This is not financial advice.
How to Use the Revenue Growth Calculator
- Currency: Choose the currency you want results shown in. It only changes the symbol; it does not convert amounts.
- Compare: Choose month over month, quarter over quarter, or year over year.
- Previous period revenue: Enter revenue for the earlier period, such as last quarter.
- Current period revenue: Enter revenue for the most recent period, such as this quarter.
Results update as you type.
How Is Revenue Growth Calculated?
- Revenue growth rate = (current revenue − previous revenue) ÷ previous revenue × 100
- Revenue change = current revenue − previous revenue
- Annualized growth rate = (current ÷ previous)periods per year − 1, using 12 for months and 4 for quarters
Example: A business earned $200,000 last quarter and $230,000 this quarter. Revenue grew $30,000, or 15.0% quarter over quarter. If it kept growing 15% every quarter for a year, revenue would rise about 74.9%.
MoM vs. QoQ vs. YoY Growth: What's the Difference?
| Type | Compares | Best for |
|---|---|---|
| Month over month (MoM) | This month with last month | Fast-moving businesses and early-stage startups |
| Quarter over quarter (QoQ) | This quarter with last quarter | Tracking short-term momentum |
| Year over year (YoY) | This period with the same period a year earlier | Removing seasonal swings, such as holiday sales |
Year-over-year growth is often the fairest comparison for seasonal businesses. A retailer's December will almost always beat its November, but comparing December with the previous December shows real growth.
Real Example: Nvidia in 2026
Nvidia reported revenue of $96.2 billion for the quarter ended July 26, 2026, up from $81.6 billion the quarter before and $46.7 billion a year earlier (Nvidia).
- Quarter over quarter: about 18% growth.
- Year over year: about 106% growth, meaning revenue more than doubled in a year.
The same quarter looks very different depending on what you compare it with. Enter these numbers in the calculator above to see both results.
Where Can You Find Revenue Figures?
- Your own business: Use total sales from your accounting software or monthly income statements.
- Public companies: Use quarterly earnings releases or filings on SEC EDGAR. Most releases already state the QoQ and YoY change.
New to these documents? Start with our guide on how to read an earnings report.
What the Revenue Growth Calculator Can and Cannot Tell You
It can show how fast revenue changed between two periods, and what that pace would mean over a year.
It cannot:
- Predict future revenue. One strong quarter doesn't guarantee the next.
- Show profit. Revenue can grow while profit falls. Try our business news impact calculator to see how revenue and cost changes affect profit.
- Remove seasonal effects in month-over-month or quarter-over-quarter comparisons.
- Project growth over many years. For that, use our business growth calculator.
Frequently Asked Questions
How do you calculate revenue growth?
Subtract last period's revenue from this period's revenue, divide by last period's revenue, and multiply by 100. For example, going from $200,000 to $230,000 is ($30,000 ÷ $200,000) × 100 = 15% growth. A revenue growth calculator does this for you instantly.
What is a good revenue growth rate?
It depends on the business's size, industry, and age. A young startup may grow far faster than a large, established company. The most useful comparison is often a business's own past growth and the growth of similar companies in the same industry.
What does annualized growth rate mean?
The annualized rate shows what a monthly or quarterly growth rate would add up to over a full year if it stayed the same. For example, 15% growth every quarter compounds to about 74.9% over a year. Real growth rarely stays that steady.
Should I use QoQ or YoY growth?
Use quarter-over-quarter growth to spot short-term changes, and year-over-year growth to compare the same season a year apart. For businesses with strong seasonal patterns, such as retailers, year-over-year growth usually gives a clearer picture.
Can revenue growth be negative?
Yes. If revenue fell compared with the previous period, the growth rate is negative. For example, going from $200,000 to $180,000 is a 10% decline. The calculator shows declines in orange so they are easy to spot.
Final Takeaway
The same revenue number can look strong or weak depending on what you compare it with. Use the calculator above to check growth month over month, quarter over quarter, and year over year before drawing conclusions.