To read an earnings report, start with the reporting period, then follow the numbers in order: revenue, margins, net income, and earnings per share. Next, compare GAAP results with any “adjusted” figures, check whether profit is turning into cash, and read the company’s guidance and footnotes. Finally, compare the results with what investors expected. The headline number is rarely the full story. A company can beat profit estimates and still see its stock fall, as Lululemon did in September 2026, when one-time tariff refunds lifted earnings while sales and guidance weakened.
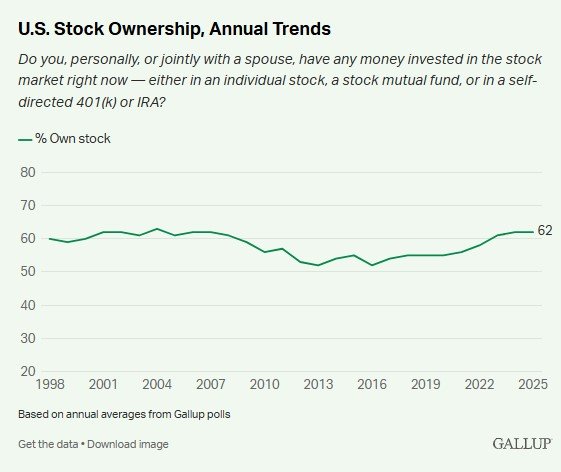
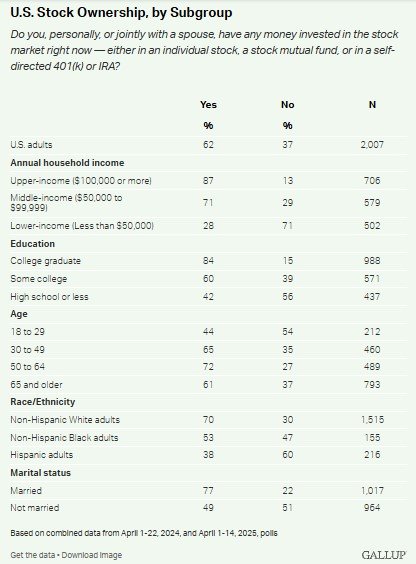
These reports matter to more people than ever. In 2025, 62% of Americans said they owned stock, directly or through funds and retirement accounts such as a 401(k) (Gallup). Yet most people only ever see the headline. Knowing how to read an earnings report lets you check that headline against the numbers behind it.
Who reads earnings reports?
How to Read an Earnings Report: Key Facts
- The earnings release comes first. US-listed companies typically publish results in a press release, then furnish it to the SEC under Item 2.02 of Form 8-K, generally within four business days (SEC).
- The full quarterly report comes later. Large companies must file their Form 10-Q within 40 days of quarter end; smaller companies have 45 days (PwC Viewpoint).
- Quarterly numbers are reviewed, not audited. Only annual statements in the Form 10-K are fully audited.
- “Adjusted” numbers can differ sharply from GAAP. In Q2 2026, Fiserv reported GAAP EPS of $1.17 and adjusted EPS of $1.84 (SEC).
- Footnotes can change the picture. Lululemon’s Q2 2026 EPS of $2.92 included $0.86 from one-time tariff refunds (SEC).
- “Beat” depends on who’s counting. Two data providers put Fiserv’s Q2 2026 EPS consensus at $1.89 and $1.91.
What Is an Earnings Report?
An earnings report is a company’s official account of its financial results for a quarter or a year. In practice, “earnings report” can mean several related documents, released at different times:
| Document | What it is | When it comes out | Audited? |
| Earnings release | Press release with headline results, summary tables, and often guidance | Usually first, on earnings day | No |
| Form 8-K (Item 2.02) | The SEC filing that carries the earnings release as an exhibit | Generally within four business days | No |
| Earnings call | Management’s presentation and analyst Q&A | Usually the same day as the release | No |
| Form 10-Q | Full quarterly report with financial statements and notes | Within 40–45 days of quarter end | Reviewed, not audited |
| Form 10-K | Full annual report | Within 60–90 days of fiscal year end (Mayer Brown) | Yes |
Most news coverage is based on the earnings release. The 10-Q and 10-K come later and contain more detail, including full notes and risk disclosures.
How to Read an Earnings Report in 7 Steps
Here is how to read an earnings report step by step. The examples below use two real reports from 2026: Lululemon’s second quarter of fiscal 2026, reported September 3, and Fiserv’s second quarter, reported August 6.
Step 1: Check the Reporting Period
Before reading any number, confirm what period it covers and what it’s compared with. Lululemon’s fiscal year doesn’t match the calendar: its “second quarter of fiscal 2026” ended August 2, 2026, and its fiscal 2026 runs to January 31, 2027 (SEC).
The comparison period matters just as much. Lululemon’s second-quarter revenue fell 4% from a year earlier, but revenue for the first half of the year was almost flat. Both figures come from the same release.
Step 2: Start With Revenue
Revenue shows whether the business is growing. Lululemon’s net revenue fell 4% to $2.42 billion, and comparable sales fell 9%. Comparable sales strip out new stores, so they show how existing stores and e-commerce performed.
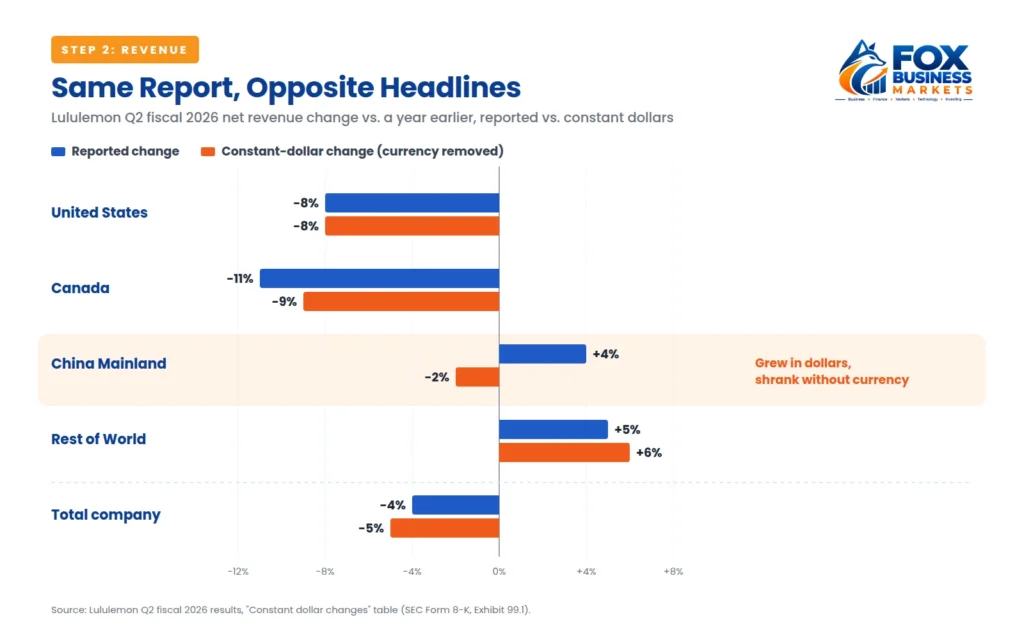
Then check currency. The release includes a “constant dollar” table that removes exchange-rate effects. In China Mainland, revenue rose 4% in reported dollars but fell 2% in constant dollars. In Canada, it fell 11% reported but 9% in constant dollars. A headline could honestly say Lululemon was “growing in China” or “shrinking in China,” depending on which column it used.
Step 3: Follow Profit Down the Income Statement
Work from the top line to the bottom line:
| Line | Lululemon Q2 2026 | Q2 2025 | What it tells you |
| Gross margin | 60.5% | 58.5% | Profit after the cost of products |
| SG&A expenses (% of revenue) | 41.7% | 37.7% | Selling, general, and administrative costs |
| Operating margin | 18.8% | 20.7% | Profit from core operations |
| Net income | $329.2 million | $370.9 million | Profit after all expenses and taxes |
Source: Lululemon Q2 fiscal 2026 results (SEC Form 8-K, Exhibit 99.1).
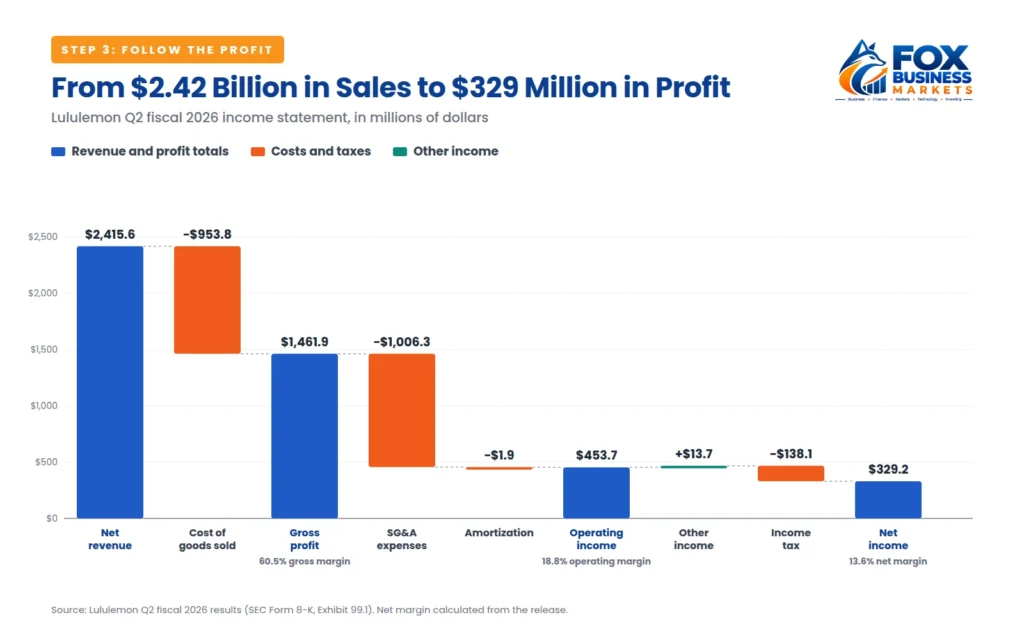
Look for lines moving in different directions. Here, gross margin rose while operating margin and net income fell. That gap is a signal to keep reading, and Step 7 explains it.
Step 4: Read Earnings Per Share Carefully
Earnings per share (EPS) is net income divided by shares outstanding. It’s the most quoted number in any earnings headline, and the easiest to misread.
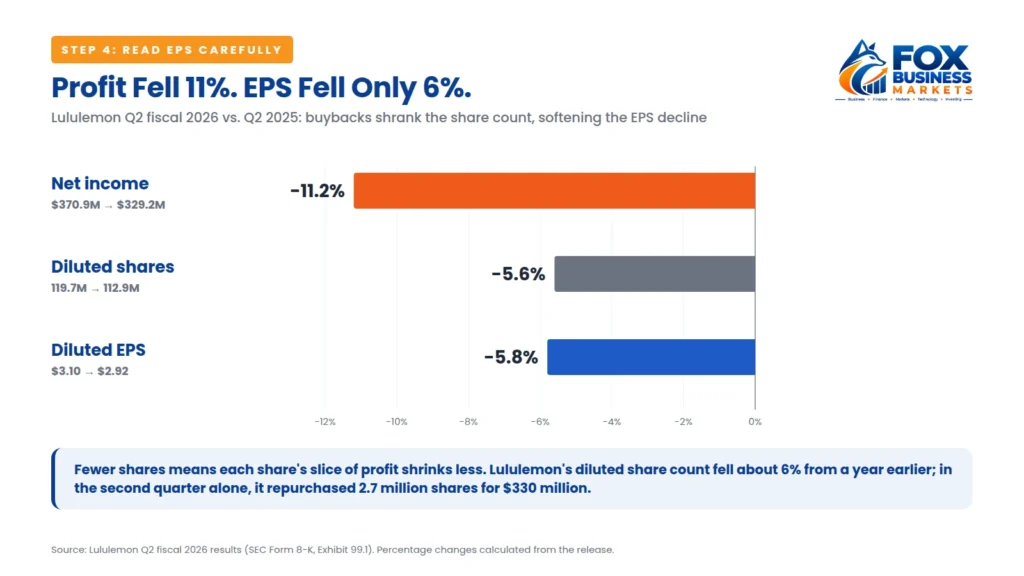
Lululemon’s diluted EPS fell about 6%, to $2.92 from $3.10, while net income fell about 11%. The difference came from buybacks: diluted shares fell from about 119.7 million to 112.9 million. Fewer shares meant each share’s slice of a smaller profit shrank less. When EPS and net income move differently, check the share count.
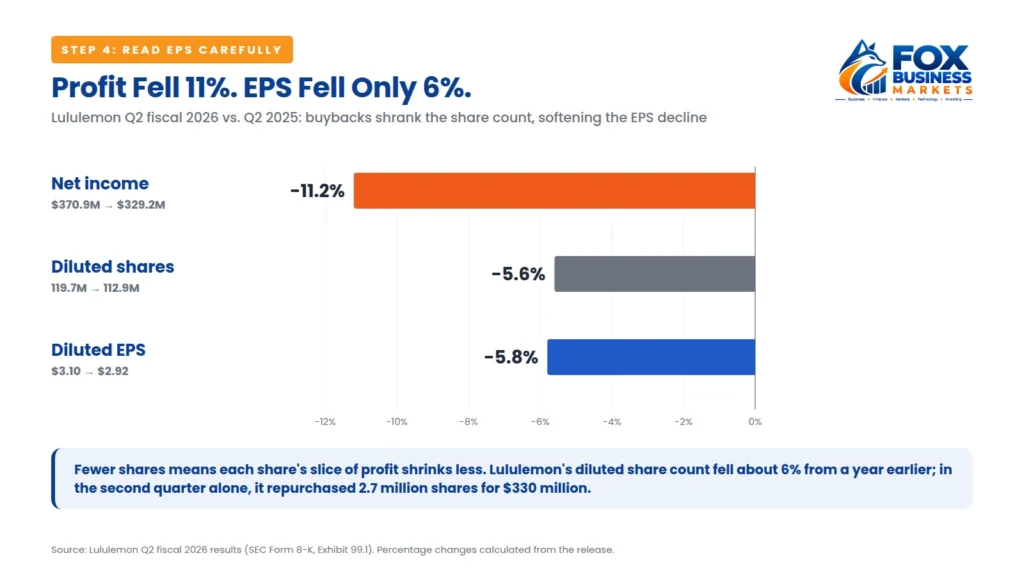
Also note the label. Basic EPS uses the average number of shares outstanding. Diluted EPS also counts shares that could be created from stock options and convertible securities. Headlines usually quote diluted EPS, but some sources use different labels for the same number.
Step 5: Compare GAAP and Adjusted Numbers
GAAP figures follow standard accounting rules. Adjusted, or non-GAAP, figures remove items management considers unusual. Companies that report adjusted figures must reconcile them to GAAP, so find the reconciliation table.
Fiserv’s second quarter of 2026 shows why this matters (SEC):
| Measure | GAAP | Adjusted |
| Q2 diluted EPS | $1.17 (down 37%) | $1.84 (down 26%) |
| Q2 operating margin | 19.2% (from 30.7%) | 31.8% (from 39.6%) |
The $0.67 gap in EPS came mainly from adding back $0.47 of amortization on acquired intangibles and $0.28 of transformation-program costs, partly offset by removing a $0.20 gain. Neither figure is wrong, but each answers a different question. If adjustments appear every quarter, ask whether they’re really one-time.
Step 6: Check Whether Profit Turns Into Cash
Profit is an accounting measure. Cash is what pays the bills. Compare net income with operating cash flow in the cash flow statement.
In the first half of 2026, Lululemon’s operating cash flow rose to $589 million from $210 million, while net income fell about 24%. The summary table doesn’t explain the difference, so the full 10-Q is the next place to look.
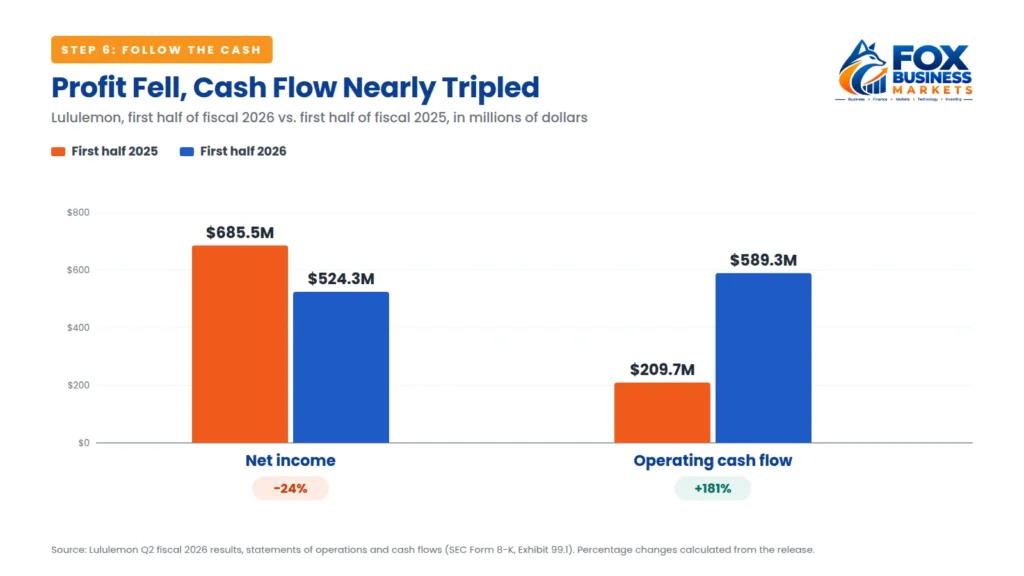
Glance at the balance sheet too, and watch the dates. Lululemon held $1.39 billion in cash at the end of the quarter, about 20% more than a year earlier but $417 million less than at the start of its fiscal year. Both comparisons are accurate; they just answer different questions.
Free cash flow needs the same care, because companies define it differently. Fiserv’s own free cash flow figure fell about 12% in the first half of 2026. Simple operating cash flow minus capital spending, calculated from the same release, fell about 25%. The company’s measure added back transformation and severance payments.
Step 7: Read the Guidance and the Footnotes
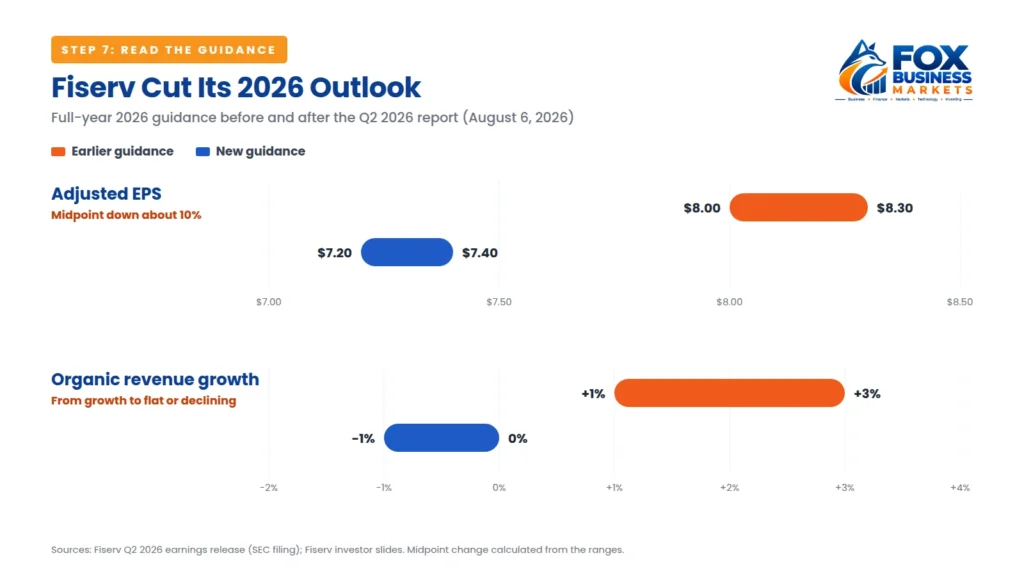
Guidance is management’s forecast for future periods, and it often moves the stock more than the quarter just reported. Lululemon now expects full-year revenue to fall 5% to 7%. Fiserv cut its 2026 adjusted EPS guidance to $7.20–$7.40 from $8.00–$8.30 (Fiserv slides).
Footnotes explain the surprises. Lululemon’s headline EPS of $2.92 carried a footnote marker. The footnote said the company had received $134.5 million in tariff refunds plus $4.1 million in interest, which together added $0.86 to diluted EPS. Without them, EPS would have been about $2.06, and gross margin would have fallen about 3.6 points instead of rising 2 points. That explains the gap you spotted in Step 3, and it’s the clearest lesson in how to read an earnings report: when a headline number moves against the rest of the results, find the footnote.
How to Listen to an Earnings Call
The earnings call is where management explains the numbers and analysts ask questions. It usually has two parts: prepared remarks, which repeat the release in management’s words, and a Q&A session, which is often more revealing.
Treat everything said on the call as management’s claim, then test it against the release. On Lululemon’s September 2026 call, management said negative social media commentary had affected the quarter (CNBC). The release shows comparable sales fell 12% in the Americas and 3% internationally, a pattern consistent with a US-focused problem, but it can’t prove the cause. On Fiserv’s call, the CFO said the change in second-half growth was “not structural” (Investing.com). That is a judgment the next few quarters will confirm or contradict.
Listen especially for:
- Questions management avoids or answers vaguely
- Changes in tone from previous calls
- New terms or metrics that weren’t in earlier reports
- Specific dates or numbers attached to promises
Where to Find an Earnings Report
Go to the source rather than a summary:
- The company’s investor relations website. Look for “Investors,” “News,” or “Financial results.” Companies usually post the release, slides, and a webcast of the call.
- The SEC’s EDGAR database. Search the company name and filter for Form 8-K. The earnings release is usually attached as Exhibit 99.1. Later, look for the 10-Q or 10-K.
- The earnings date. Companies announce it in advance on their investor relations pages, so you can read the release as soon as it’s out, before the coverage.
Learning how to read an earnings report from the original document, not a news summary, is the single habit that changes what you notice. For more on tracing any business claim back to its source, see our guide on how to verify business news.
Why Can a Stock Fall After an Earnings “Beat”?
Because the market reacts to results compared with expectations, and to the outlook, not just to the headline profit. Lululemon’s EPS beat analysts’ estimates, but revenue missed and the company cut its forecast. Its shares fell about 17% in premarket trading, according to one report (Yahoo Finance).
“Beat” and “miss” also depend on whose estimate you use. For Fiserv’s second quarter, Zacks put the consensus at $1.89 per share (Yahoo Finance), while Investing.com cited $1.91 (Investing.com). When you read that a company “beat by 2 cents,” check which consensus the source used.
Earnings Report Red Flags
Part of learning how to read an earnings report is knowing which warning signs deserve a closer look:
| Red flag | Why it matters |
| Adjusted profit far above GAAP profit | Large add-backs may hide recurring costs |
| The same “one-time” items every quarter | They may not be one-time |
| EPS rising faster than net income | Buybacks may be doing the work |
| Profit rising while operating cash flow falls | Earnings may not be turning into cash |
| Guidance cut or withdrawn | Management expects weaker results ahead |
| A headline number moving against the rest of the report | The explanation is usually in a footnote |
| Results described only in percentages | The base and comparison period are missing |
How to Read an Earnings Report: A Quick Checklist
- What period does the report cover, and what is it compared with?
- Did revenue grow, and how much of the change was currency?
- Which way did gross margin, operating margin, and net income move?
- Did EPS move with net income, or did the share count change?
- How far apart are GAAP and adjusted figures, and what was added back?
- Is operating cash flow keeping up with profit?
- What does guidance say, and was it raised, kept, or cut?
- What do the footnotes explain?
- How do the results compare with expectations, and whose estimate is it?
What an Earnings Report Can and Cannot Tell You
An earnings report can tell you what the company sold, what it earned, how much cash it generated, what it owns and owes, and what management expects next.
It cannot tell you:
- Whether the guidance will come true. Forecasts are management’s claims, not facts.
- Whether management’s explanations are right. When a company blames weak sales on a single cause, test it against the numbers rather than accepting it.
- Everything at once. The earnings release is a summary. The 10-Q or 10-K has the full notes.
- Whether to buy or sell. That depends on valuation, your goals, and risks a single quarter can’t capture.
Knowing how to read an earnings report shows you what happened. For a broader framework that applies to any business story, see our guide on how to analyze business news.
Frequently Asked Questions
How do you read an earnings report for beginners?
Start with the period and the comparison, then read revenue, margins, net income, and EPS in that order. Compare GAAP with adjusted figures, check operating cash flow, and read the guidance and footnotes. Finally, compare the results with analysts’ expectations and note whose estimate is being used.
How long does it take to learn how to read an earnings report?
Most readers can follow the seven steps on a real report within a few weeks of practice. Start with companies you know, read the release before the news coverage, and compare what you noticed with what the headlines said. The footnotes and the reconciliation tables are where the skill builds fastest.
What is the most important number in an earnings report?
No single number tells the whole story. Revenue shows growth, margins show profitability, cash flow shows whether profit is real cash, and guidance shows what management expects. Many investors watch guidance most closely because stocks often react more to the outlook than to the quarter just reported.
What is the difference between an earnings release and a 10-Q?
The earnings release is a press release with summary results, usually published first and furnished to the SEC on Form 8-K. The 10-Q is the full quarterly report, filed within 40 to 45 days of quarter end, with complete financial statements, notes, and risk disclosures.
Why do companies report adjusted earnings?
Companies say adjusted earnings remove items that don’t reflect ongoing operations, such as acquisition-related amortization or restructuring costs. Because companies choose what to adjust, compare adjusted figures with GAAP and check the reconciliation table. Fiserv’s Q2 2026 adjusted EPS was $1.84, versus $1.17 under GAAP.
What does it mean when a company beats earnings but the stock falls?
It usually means investors focused on something else, such as weak revenue, lower guidance, or a one-time item behind the beat. Lululemon beat EPS estimates in Q2 2026, but its earnings included tariff refunds, revenue missed, and the company cut its outlook.
What should I read first in an earnings report?
Start with the headline table, but read it for the period and comparison, not just the numbers. Then go straight to guidance and the footnotes. Anyone learning how to read an earnings report should check those two sections early, because they often explain why the stock moves.
Where can I find a company’s earnings report?
Check the company’s investor relations website or the SEC’s EDGAR database. The earnings release is usually attached to a Form 8-K as Exhibit 99.1, and the full quarterly or annual report appears later as a Form 10-Q or 10-K.
Final Takeaway
Learning how to read an earnings report comes down to reading past the headline. Ask: What period is this? Did revenue really grow? Is profit turning into cash? What did the adjustments and footnotes change? What does guidance say?
If a news story about earnings seems too simple, it probably is. Trace it back to the release itself, using our guide on how to verify business news.