
Below is how to analyze business news in eight steps. After it, each step is explained and then applied to real cases.
More people can reach business news today than at any point in history, and fewer of them trust it. As of April 2026, about 6.12 billion people use the internet, and there are 5.79 billion social media user identities worldwide (DataReportal). The Reuters Institute’s 2026 Digital News Report surveyed about 97,500 people in 48 markets. It found that 54% now get news from social media and video networks, while trust in news fell to 37%, its lowest level since 2015, and interest in news dropped from 59% in 2021 to 46% (Reuters Institute).
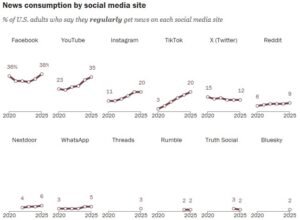
In the United States the gap is wider. 53% of adults say they at least sometimes get news from social media (Pew Research Center, 2025), yet only 25% say they trust most news most of the time (Reuters Institute). In business news, that gap has a price. A false or incomplete headline can move a stock before anyone opens the filing behind it, and two real cases later in this guide show how much.
Analyzing business news means checking a story against evidence before you accept it. That means asking who is reporting it, what the original record says, which numbers support it, and what is still unknown. Headlines compress complicated events into one number or one verb, and the compressed version is often the least reliable part of the story.
The short version is below. After it, each step is explained and then applied to real cases: two company filings (Lululemon and Fiserv) and two false social media posts that moved stock prices (Eli Lilly and the Associated Press).
How to Analyze Business News: The Quick Answer
- Identify the event. What actually happened, and is it confirmed or only expected?
- Evaluate the source. Who is reporting it, and how do they know?
- Verify the evidence. Find the original document or dataset.
- Examine the numbers. Against which baseline are they measured?
- Add context. Compare with prior periods, expectations, and the industry.
- Work out the causes. Separate internal factors from external ones.
- Map the stakeholders and impact. Who is affected, and over what time frame?
- State the uncertainty. What is known, what is claimed, what is still open?
Event → Source → Evidence → Numbers → Context → Causes → Stakeholders and impact → Uncertainty
The goal is not to predict what happens next. The goal is to understand what the available evidence actually supports.
What Does It Mean to Analyze Business News?
A news report tells you what happened. Analysis asks why it happened and what follows. Opinion is someone’s judgment, and a forecast is someone’s guess about the future. Most articles blend all four, often in one paragraph.
| Business news | Business analysis |
| Reports an event | Explains why it matters |
| Focuses on what happened | Examines why and how |
| Often immediate | Adds context and comparison |
| Quotes sources | Tests the evidence behind the quotes |
| Can be brief | Usually takes deeper digging |
Knowing how to analyze business news starts with keeping those four apart.
Types of Business News You May Need to Analyze
The framework stays the same across all of these. What changes is where you look for evidence.
| Type of news | Where the evidence usually lives |
| Company and earnings news | Earnings releases, annual and quarterly reports, regulatory filings |
| Mergers and corporate deals | Deal announcements, filings, regulator decisions |
| Economic news | Statistical agencies, central banks |
| Industry news | Trade bodies, industry reports, peer company results |
| Regulatory news | The regulator’s own announcements and rulings |
| Consumer and business trends | Survey data, sales data, official statistics |
| Management changes | Company announcements and filings |
| Strategy and product news | Company statements, investor presentations, later results |
| Labor and workforce news | Employment statistics, company disclosures |
| International trade news | Customs and trade data, official government notices |
Step 1: Start With the Original Event
Every method for how to analyze business news starts in the same place: the event itself. Ask what happened, when, to whom, and whether it is confirmed. “Company X announced a 10% workforce reduction” and “analysts expect Company X may cut jobs” are different claims, and headlines blur them constantly.
For US-listed companies, confirmation often sits in an SEC filing. Form 8-K is the “current report” companies file to announce major events shareholders should know about, generally within four business days of the triggering event (SEC, Investor.gov). The information it requires is generally “material,” meaning a reasonable investor would likely consider it important (SEC). If a story says a company signed a big deal, check whether the filing exists.
Real-Life Example: “Insulin Is Free Now”
On November 10, 2022, days after Twitter began selling blue checkmarks for $8 a month, an impostor account called @EliLillyandCo posted: “We are excited to announce insulin is free now.” The account carried a checkmark, and the post stayed up for hours. Eli Lilly’s real account, @LillyPad, later apologized to people who had been “served a misleading message from a fake Lilly account.” The next day, Lilly shares fell more than 4% (Forbes).
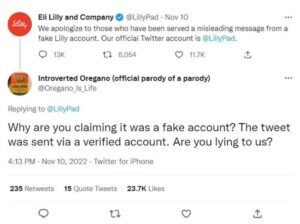
The causes need checking too. Rival insulin makers Novo Nordisk and Sanofi also fell that day, by about 5.1% and 4.5% (Semafor), so the post may not explain the whole drop. One fake post produced two errors worth catching: a false event, and an overly simple explanation for a price move.
The check: a real price change on a company’s main product would appear in a press release on its investor relations page, and a material event would usually appear in an 8-K. If neither exists, treat the claim as unconfirmed, however official the account looks.
Step 2: Evaluate the Source
Look at the publisher, the author, the date, whether original documents are linked, whether sources are named, and whether corrections are logged. Ask whether the outlet has a stake in the story.
A Source Hierarchy for How to Analyze Business News
| Tier | What it is | Examples |
| 1. Primary evidence | The original record | Regulatory filings, company filings, government data, court documents, official announcements |
| 2. High-quality secondary reporting | Journalists who verify and explain | Established business and financial publications, specialist trade press |
| 3. Commentary | Interpretation of the facts | Analysts, experts, industry commentators |
| 4. Unverified distribution | Content with no clear origin | Social posts, aggregators, reposted claims, anonymous screenshots |
A lower-tier source is not automatically false. It simply needs stronger verification. Anonymous sourcing works the same way: some important stories can only come from people who can’t be named. Treat those claims as unconfirmed until a filing, a statement, or a second independent source backs them up.
Real-Life Example: The Post That Erased $136 Billion
At 1:07 p.m. on April 23, 2013, hackers used the Associated Press’s verified Twitter account to post that two explosions at the White House had injured President Obama. The account belonged to one of the most trusted names in news, so the post looked like Tier 2 reporting. It was really Tier 4: an unverified claim on a compromised channel. Within minutes, the Dow Jones Industrial Average fell about 143 points, and the S&P 500 temporarily lost more than $136 billion in value (University at Buffalo). Prices recovered almost as quickly once AP and the White House said the report was false (IEEE Spectrum).
The lesson: judge the claim, not the logo. A breaking claim that appears only on social media, with no story on the outlet’s own website and no confirmation from another wire service or an official source, is still unverified.
Leave the Page
The most useful habit is checking a source by reading about it elsewhere. A 2017 Stanford study observed 45 people evaluating live websites: 10 PhD historians, 10 professional fact checkers, and 25 undergraduates (Stanford). In one task, all the fact checkers identified the legitimate pediatric organization, compared with 50% of the historians and 20% of the undergraduates. The difference was that fact checkers read “laterally,” leaving the page to open new tabs and check a source’s reputation, ties, and claims (Stanford GSE). Do the same with any unfamiliar outlet.
Step 3: Verify the Evidence
Four habits cover most of it. Check the date, because a story about an outlook can be stale within weeks. Ask what the evidence is: a link to a filing is evidence, while “people familiar with the matter” is a lead. Look for independent confirmation: ten sites repeating one report are one source, not ten. Watch for revisions, because official statistics are often revised after their first release.
The best way to see this in practice is to trace one claim all the way back.
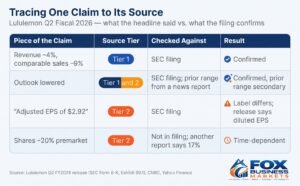
Recent Example: Tracing One Claim to Its Source
This example uses Lululemon’s second quarter of fiscal 2026, reported on September 3, 2026.
The claim: CNBC reported that Lululemon shares plunged 20% in premarket trading after another disappointing quarter and a cut to the annual outlook (CNBC).
- Split the claim into checkable pieces. There are three: the results disappointed, the outlook was cut, and the shares fell 20%. The first two are about the company. The third is about the market. They come from different places.
- Find the company’s own release. Search the company name plus “announces second quarter results.” The same release appears on the company’s newsroom, on Business Wire, on Nasdaq, on Yahoo Finance, and in the SEC’s EDGAR database as Exhibit 99.1 to a Form 8-K. These are copies of one document, not five sources. One copy is even labelled a paid press release, a reminder that this is the company’s own account (Business Wire, SEC copy).
- Check the pieces against the filing. The release reports revenue down 4% to $2.4 billion, comparable sales down 9%, and a lowered outlook with full-year revenue expected to fall 5% to 7%. The earlier guidance came from a secondary report: the company had previously expected annual revenue to be flat or down by as much as 1% (Yahoo Finance). So “outlook cut” holds up, but the “before” figure isn’t from a primary source.
- Check the labels. That Yahoo report described the $2.92 as adjusted earnings per share. The release itself calls it diluted EPS. It’s a small difference, and exactly the kind you only catch by opening the original.
- Confirm the market piece separately. The 20% figure isn’t in any filing. It’s a price move reported by a news outlet, and it depends on timing: an earlier Yahoo report put the premarket drop at more than 17%. Same event, different moments. When you quote a market move, say when it was measured.
- Record what you verified.
Step 4: Examine the Numbers
Look Beyond the Headline Number
“Revenue rose 20%” raises questions. Compared with what period? Was the growth organic, or did an acquisition add it? Did currency help? Did profit rise too, or did margins shrink?
The same data can produce different headlines. The August 2026 Consumer Price Index rose 0.4% on a seasonally adjusted basis in August after rising 0.1% in July, and rose 3.4% over the last 12 months on a not-seasonally-adjusted basis (BLS). Both are correct. One is the monthly change, the other the annual change, and a headline can lead with either.
Know the Metrics That Matter for How to Analyze Business News
| Metric | What it tells you |
| Revenue | Sales generated |
| Gross profit | Profit after direct costs |
| Operating income | Profit from core operations |
| Net income | Profit after all expenses |
| EPS | Earnings per share |
| Operating margin | How much of each sales dollar becomes operating profit |
| Free cash flow | Cash generated after capital spending |
| Debt and cash | Obligations and available liquidity |
Compare reported profit with operating cash flow and free cash flow to see whether accounting earnings are turning into cash generation.
How to Analyze Business News: Read the Footnotes
Headlines quote the top of a press release. Explanations often sit in the footnotes. Lululemon’s headline read “Diluted EPS of $2.92” followed by a footnote marker. The footnote explained that the company had received $134.5 million of tariff refunds plus $4.1 million of interest, recorded as a reduction of cost of goods sold and as other income, and that together they raised diluted EPS by $0.86 (company release).
Here is what that does to the picture. The last column uses the same release’s prior-year figures. The “without refunds” column is approximate, calculated from the release:
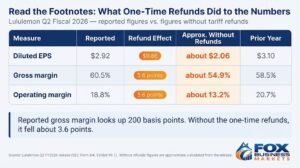
Gross margin looks like it rose 200 basis points. Without the one-time refunds, it fell by roughly 3.6 points. The lesson: when a headline number moves against the rest of the story, read the footnotes.
Don’t Judge Earnings From EPS Alone
EPS can rise for reasons unrelated to business performance, such as buybacks, one-time items, or accounting changes. McKinsey described a company that retired about a fifth of its shares over five years and lifted EPS by more than 8 percent, yet was only retiring shares faster than net income was falling (McKinsey).
The Lululemon release shows the same effect in one line. Net income fell about 11% from a year earlier, but EPS fell only about 6%, because diluted shares dropped from roughly 119.7 million to 112.9 million after the company repurchased 2.7 million shares for $330 million. Compare net income growth with EPS growth, then check the share count.
Check “Adjusted” Numbers
Many earnings headlines quote adjusted (non-GAAP) figures. Companies that present them must reconcile to the most comparable GAAP measure, and SEC staff note that non-GAAP measures are not always consistent across companies (SEC). In SEC filings, the GAAP measure must be given equal or greater prominence (Covington). Find the reconciliation table and see what was added back. The Fiserv example below shows how large the gap between GAAP and adjusted can be.
Step 5: Add Context
- Previous periods. Year-over-year removes seasonality. Quarter-over-quarter shows momentum. A longer history shows whether this quarter is unusual.
- Results are measured. against actuals, prior guidance, analyst consensus, and management forecasts. A company can report higher profit and still disappoint if expectations were higher.
- The industry. Is the company growing faster than competitors, or is the whole sector moving the same way? A company-specific problem and an industry-wide one call for different conclusions.
Step 6: Work Out the Causes
Sort causes into two piles. Internal: pricing, sales volume, costs, product launches, management decisions, acquisitions, staffing. External: interest rates, inflation, exchange rates, regulation, consumer demand, commodity prices, competition, supply chains. Two things happening together doesn’t prove one caused the other.
Management’s explanation is a claim, so test it against the numbers. If the stated cause is costs, gross margin should fall. If it is demand, volumes or comparable sales should fall. If it is currency, constant-currency growth should look better than reported growth.
Lululemon gives a live case. Management said on the earnings call that negative social-media commentary affected the quarter (CNBC). Treat that as a claim. What the release lets you test: comparable sales fell 12% in the Americas but 3% internationally, and selling, general and administrative expenses rose to 41.7% of revenue from 37.7% (company release). That pattern is consistent with a problem concentrated in the US market. It doesn’t prove what caused it.
Step 7: Map the Stakeholders and the Impact
Who is affected?
- Customers: prices, availability, service.
- Employees: hiring, layoffs, wages, conditions.
- Investors: expected earnings, risk, cash flow.
- Competitors: does the event change the competitive picture?
- Suppliers and partners: contracts, orders, payment terms.
- Governments and regulators: policy or compliance changes.
When are they affected? Separate the short term (what changes right away), the medium term (the next few quarters), and the long term (business model, market share, profitability, strategy).
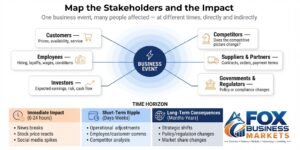
Then separate direct impact from indirect impact. If a large retailer says sales are shrinking, a supplier that sells to it has to plan for smaller orders, even though the supplier never appears in the story.
Step 8: State the Uncertainty
End every analysis with a short template:
- Known: what the primary sources confirm.
- Claimed: what someone says but you haven’t verified.
- Uncertain: what nobody can know yet.
- What would change my view: the next data point or filing that would confirm or contradict your reading.
If you can’t fill in the third and fourth lines, you haven’t looked hard enough.
Applying the Framework to Different News
Earnings news
Check revenue, earnings, margins, cash flow, guidance, segment performance, debt and cash, management commentary, and results against expectations. Guidance often matters more than the quarter just reported.
Economic news
Interest rates affect borrowing costs, demand, housing, and investment. Inflation affects input costs, wages, and margins. Employment data shapes demand across the economy.
Recent example: the August 2026 jobs report. Payrolls rose by 162,000, above the average monthly gain of 31,000 over the prior 12 months, and the July figure was revised from a loss of 23,000 to a gain of 21,000 (BLS). Consensus had been 53,000, and traders raised bets on a potential rate hike at the policy meeting (CNBC). Strong hiring is good news for workers and can still be read as pressure on borrowing costs. The revision is a reminder that a story built on the first July number would have been wrong on direction.
If the Business Is Outside the United States
The principles are the same everywhere. What changes is the regulator, the filing system, the stock exchange, the statistics agency, and the disclosure rules.
- United Kingdom: the FCA’s National Storage Mechanism is the official system for regulated information that listed issuers must disclose under the Listing Rules and the Disclosure Guidance and Transparency Rules (FCA).
- Australia: ASX Listing Rule 3.1 requires a listed entity to immediately tell ASX any information that a reasonable person would expect to have a material effect on the price or value of its securities (ASX Guidance Note 8). Announcements are released through the ASX Market Announcements Platform, and the corporate regulator is ASIC.
- Canada: SEDAR+ is the system used to file, disclose, and search for information in Canada’s capital markets (Canadian Securities Administrators). When a material change occurs, a reporting issuer must immediately issue a news release and file a material change report within 10 days (National Instrument 51-102, section 7.1). Oversight comes from provincial and territorial securities regulators, such as the Ontario Securities Commission.
Portals and rules change, so confirm the current link before relying on one.
Business News vs. Stock Market Reaction
Part of learning how to analyze business news is separating the business from the stock. Business performance and stock-price performance are related, but they are not the same thing. The chain looks like this:
Business result → compared with expectations → new information → market interpretation → price reaction
In the Lululemon example, the headline EPS looked strong, yet the reaction followed sales, margins without the refunds, and a lowered outlook. Treat this as a way to read a reaction. It is not a guide to what to buy or sell.
Three mistakes are worth avoiding:
- Treating good company news as good stock news. A strong result can still fall short of what was already priced in.
- Treating management statements as independent evidence. They are the company’s own account until something else supports them.
- Ignoring the time frame. A premarket move, a closing move, and a month’s move can tell different stories.
Worked Example: Fiserv’s Second Quarter, August 2026
Figures are as of the August 2026 release.
Here is how to analyze business news from start to finish, using one company’s results.
Headline claim: Fiserv cut its 2026 outlook after a weak second quarter.
- Event. On August 6, 2026, Fiserv reported second-quarter results and lowered its 2026 outlook. The company’s SEC filing confirms it: adjusted EPS guidance is now $7.20 to $7.40, and organic revenue growth is now expected at between −1% and 0% (company release, SEC). The earlier outlook was 1% to 3% organic growth and adjusted EPS of $8.00 to $8.30 (Fiserv investor slides).
- Source. The SEC exhibit is Tier 1. Two Tier 2 reports both say earnings missed expectations, but they cite different consensus figures: Zacks put it at $1.89 (Yahoo Finance), while Investing.com’s call summary says $1.91 (Investing.com). Consensus depends on the data provider, so always say whose figure you are quoting.
- Evidence and numbers. Everything below is from the release unless marked.
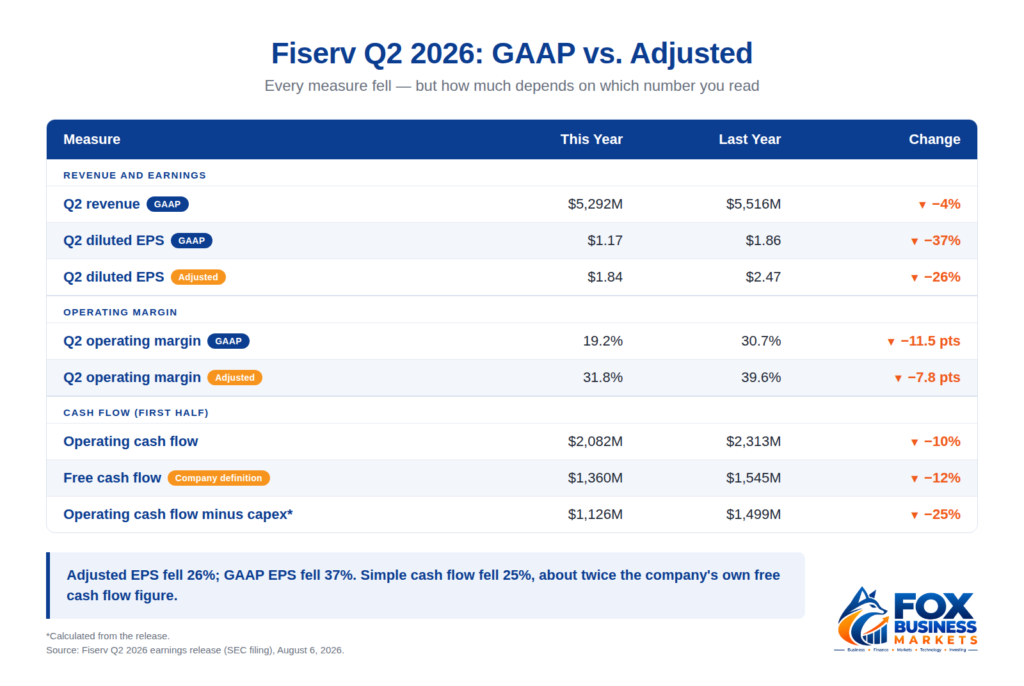
Read the reconciliation. The gap between GAAP EPS ($1.17) and adjusted EPS ($1.84) is $0.67 per share. The biggest items added back were $0.47 for amortization of acquired intangibles and $0.28 for One Fiserv transformation program expenses, while $0.20 from a gain on early debt extinguishment was removed. The company’s free cash flow also adds back $159 million of transformation payments and $122 million of severance, merger and integration payments. Simple operating cash flow minus capital spending shows a bigger fall (about 25%) than the company-defined figure (about 12%). Neither number is wrong. They answer different questions.
- Context. Against the prior year, both segments weakened: Financial Solutions revenue fell 8% and its operating margin dropped from 48.7% to 38.7%, while Merchant Solutions revenue fell 1% and its margin dropped from 34.6% to 30.0%. Against expectations, an executive’s earlier remarks, filed with the SEC, said first-half revenue would decline by a low single-digit percentage, implying second-half growth of 6% to 8% (SEC filing). The new outlook resets that. The release cannot tell you whether this is company-specific or industry-wide. Answering that requires comparing peers’ reports.
- Causes. Management’s explanation is a claim. On the call, the CFO said the change in second-half growth is not structural and broke the shortfall into delays in newly contracted revenue and enterprise client ramps, lower key product and other revenue, Argentina, and divestitures (call summary, Investing.com). Part of this is checkable: the release’s guidance table shows a divestiture adjustment. Part is not. In the income statement, cost of processing and services rose to $1,706 million from $1,412 million while revenue fell, which is what squeezes margins. Whether the shortfall is “not structural” is a judgement the filing cannot verify.
- Stakeholders and impact. Shareholders face a lower earnings base: the midpoint of adjusted EPS guidance fell about 10% ($7.30 against $8.15, calculated from the release and slides). Employees are affected by severance costs of $113 million in the first half, up from $29 million. Bondholders were offered a tender for $1.41 billion of notes while the company issued €1.0 billion of new notes. Enterprise clients waiting on implementations are the ones management says are causing the delays.
- Uncertainty.
- Known: results, margins, and the lowered outlook.
- Claimed: that the second-half change is not structural.
- Uncertain: whether implementations catch up, and whether transformation costs stop recurring.
- What would change my view: third-quarter organic growth and whether adjustments keep appearing in future reports.
- Conclusion. Not “buy” or “sell.” A fair summary: revenue and margins fell, the guidance cut is confirmed, adjusted figures look much better than GAAP ones because of large add-backs, management’s explanation is plausible but partly unverifiable, and the next filing will show whether the delays were temporary.
A Research Workflow That Works
Headline → original article → primary source → data → context → independent confirmation → analysis.
The path to avoid is headline → social post → copied article → conclusion. It’s fast, but you end up holding a repeated claim.
FAQ’s of How to Analyze Business News:
How to analyze business news as a beginner?
Start with one story, find the original filing or dataset, and check each number against it before reading any commentary.
How long does it take to learn how to analyze business news?
Most readers can apply the eight steps to an earnings story within a few weeks of practice. The habit that matters most is opening the original filing every time.
What should you look for when reading business news?
The original event, who is reporting it, links to primary documents, the comparison behind each number, and whether claims are separated from facts.
How can you tell whether business news is credible?
Check the publisher’s track record, whether sources are named, the date, and whether the claim links to a filing or dataset. Verify unfamiliar outlets by searching for what others say about them.
How do you verify a business news story?
Find the original event or document, then confirm it with a second independent source. For listed companies, check regulatory filings and the company’s own release.
How do you know if a business news story is misleading?
Warning signs include a missing comparison period, forecasts written as facts, one metric doing all the work, and no link to a primary source.
What is the difference between business news and business analysis?
News reports the event. Analysis explains its significance using evidence and context.
How do you tell facts from opinions in business news?
Ask whether a statement can be checked against evidence. A revenue figure can be checked. A view about its cause is an interpretation.
How do you analyze financial numbers in the news?
Identify the comparison period, read profit alongside cash flow, and look for adjustments and one-time items in the footnotes.
Does positive business news always mean a stock will rise?
No. Prices react to results relative to expectations and to the outlook.
Key Takeaways of How to Analyze Business News
Learning how to analyze business news comes down to one habit: trace every claim back to its source.
- Don’t analyze the headline alone. Trace it to a primary source.
- Rank your sources, and verify lower-tier claims against higher ones.
- Read the footnotes, and compare adjusted or headline numbers with the underlying ones.
- Test management’s explanations against the data.
- Say clearly what is known and what remains uncertain.