
Earnings Growth Calculator: Find EPS and Net Income Growth
The Earnings Growth Calculator shows how much a company's profit grew or fell between two periods. Enter earnings per share (EPS) or net income for the previous and current period, then choose quarter over quarter, year over year, or full year. Unlike most calculators, it also handles losses, showing when a company turned profitable or when its loss narrowed.
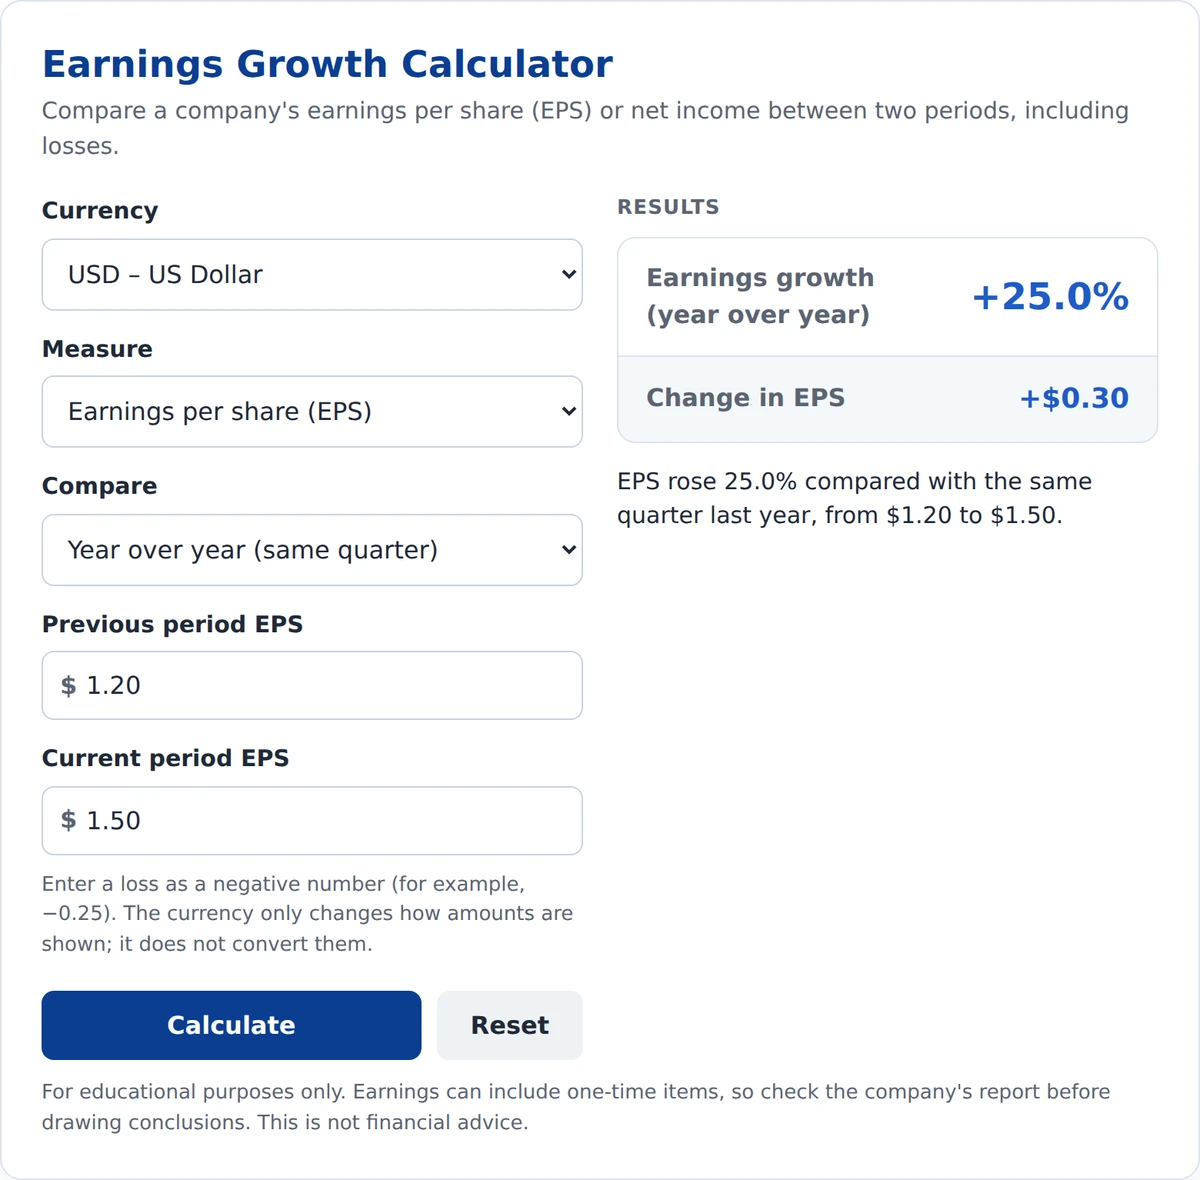
Compare a company's earnings per share (EPS) or net income between two periods, including losses.
Enter a loss as a negative number (for example, −0.25). The currency only changes how amounts are shown; it does not convert them.
Results
For educational purposes only. Earnings can include one-time items, so check the company's report before drawing conclusions. This is not financial advice.
How to Use the Earnings Growth Calculator
- Currency: Choose the currency you want results shown in. It only changes the symbol; it does not convert amounts.
- Measure: Choose earnings per share (EPS) or net income.
- Compare: Choose quarter over quarter, year over year (the same quarter a year apart), or full year vs. the previous year.
- Previous and current earnings: Enter earnings for both periods. Enter a loss as a negative number, such as −0.25.
Results update as you type.
How Is Earnings Growth Calculated?
- Earnings growth rate = (current earnings − previous earnings) ÷ previous earnings × 100
- Earnings change = current earnings − previous earnings
Example: A company earned $1.20 per share in the third quarter last year and $1.50 per share in the third quarter this year. EPS rose $0.30, or 25.0% year over year.
What If a Company Had a Loss?
The standard formula gives misleading results when earnings are negative. For example, going from a $1 loss to a $1 profit works out to "−200%," even though the company improved. That's why the calculator shows a clear result instead:
| Previous period | Current period | Result shown |
|---|---|---|
| Profit | Bigger or smaller profit | Growth rate in percent |
| Profit | Loss | Swung to a loss |
| Loss | Profit | Turned profitable |
| Loss | Smaller loss | Loss narrowed |
| Loss | Bigger loss | Loss widened |
EPS vs. Net Income: Which Should You Use?
- Net income is the company's total profit after all costs and taxes.
- Earnings per share (EPS) is net income divided by the number of shares. It shows how much profit belongs to each share.
The two can grow at different rates. If a company buys back its own shares, there are fewer shares, so EPS can grow faster than net income. Investors usually focus on EPS because it reflects what each shareholder earns.
Real Example: Microsoft in Fiscal 2026
For the fiscal year ended June 30, 2026, Microsoft reported net income of $133.7 billion and diluted EPS of $17.95, up from $101.8 billion and $13.64 a year earlier (Microsoft).
- Net income growth: about 31%
- EPS growth: about 32%
EPS grew slightly faster than net income because Microsoft had fewer shares outstanding. Enter these numbers in the calculator above, using "Full year vs. previous year," to check the results.
Where Can You Find Earnings Figures?
- Earnings releases: Every public company reports EPS and net income each quarter, usually on its investor relations website.
- SEC filings: Quarterly (10-Q) and annual (10-K) reports are free on SEC EDGAR.
- GAAP vs. adjusted: Many companies report both. Compare the same type for both periods.
New to these documents? Start with our guide on how to read an earnings report.
What the Earnings Growth Calculator Can and Cannot Tell You
It can show how fast profit or EPS changed between two periods, and whether a company moved into or out of a loss.
It cannot:
- Separate one-time gains or charges from ongoing earnings. Check the company's report for these.
- Tell you whether earnings beat or missed analyst expectations.
- Predict future earnings or stock prices.
- Show sales growth. For that, use our revenue growth calculator.
Frequently Asked Questions
How do you calculate earnings growth?
Subtract the previous period's earnings from the current period's earnings, divide by the previous period's earnings, and multiply by 100. For example, EPS rising from $1.20 to $1.50 is ($0.30 ÷ $1.20) × 100 = 25% growth. An earnings growth calculator does this instantly.
What is EPS?
EPS, or earnings per share, is a company's net income divided by its number of shares. It shows how much profit each share earned. Companies report EPS every quarter, and it is one of the most watched numbers in an earnings report.
Why can't you calculate a percentage when a company has a loss?
Because the starting number is negative, the math flips the sign. Going from a $1 loss to a $1 profit gives −200%, which suggests things got worse when they improved. That's why the calculator shows "Turned profitable" or "Loss narrowed" instead.
Why did EPS grow faster than net income?
Usually because the company bought back shares. With fewer shares, each one gets a bigger slice of profit, so EPS rises faster than net income. The opposite happens when a company issues new shares.
What's the difference between earnings growth and revenue growth?
Revenue growth measures sales. Earnings growth measures profit after all costs. A company can grow revenue while earnings fall if its costs rise faster. Looking at both gives a fuller picture of how a business is doing.
Final Takeaway
Earnings growth shows whether a company is turning more of its sales into profit. Use the calculator above to compare EPS or net income across periods, and check the company's report for one-time items before drawing conclusions.