Employee Productivity Calculator: Revenue & Profit per Employee
This free employee productivity calculator measures workforce operating efficiency by calculating revenue per employee, net operating profit per employee, and human capital return on investment (HCROI). It enables business owners, corporate executives, and operational analysts to benchmark organizational efficiency against industry standards and evaluate staffing scalability.
Who it's for: Chief Operating Officers (COOs), financial directors, department leaders, startup founders, and equity research analysts assessing organizational output and labor capital allocation.
Why use it:
- Quantify Workforce Output: Determine exact commercial revenue and operating profits generated for every full-time equivalent (FTE) seat on your payroll.
- Measure Human Capital ROI: Discover how many dollars of gross revenue your business generates for every single dollar spent on fully loaded compensation.
- Benchmark Against Industry Quartiles: Compare team performance against institutional sector averages across software, professional services, retail, and manufacturing.
How to Use the Employee Productivity Calculator
- Enter Gross Annual Revenue: Input total annualized commercial sales generated by the enterprise.
- Input Full-Time Equivalent (FTE) Headcount: Enter total full-time equivalent staff. For part-time workers, convert hours worked into fractional full-time employees (e.g., two 20-hour workers = 1.0 FTE).
- Input Annual Operating Profit (EBITDA): Enter your net operating income before interest, taxes, and depreciation to calculate profit contribution per employee.
- Set Total Loaded Payroll Expenditures: Input all-in company payroll expenses, including wages, employer taxes, healthcare premiums, and retirement contributions (model this using our Cost per Employee Calculator).
- Analyze Productivity & Return Metrics: Inspect revenue per FTE, operating profit per FTE, Human Capital ROI (HCROI), and hourly commercial generation.
How It Works & Workforce Productivity Formulas
Employee productivity metrics evaluate human capital efficiency across top-line revenue, bottom-line profitability, and payroll investment returns:
Revenue per employee provides the standard macro benchmark used by institutional analysts to measure business scalability. Human Capital ROI (HCROI) verifies whether additional headcount generates sufficient margin expansion to justify corporate payroll expansion.
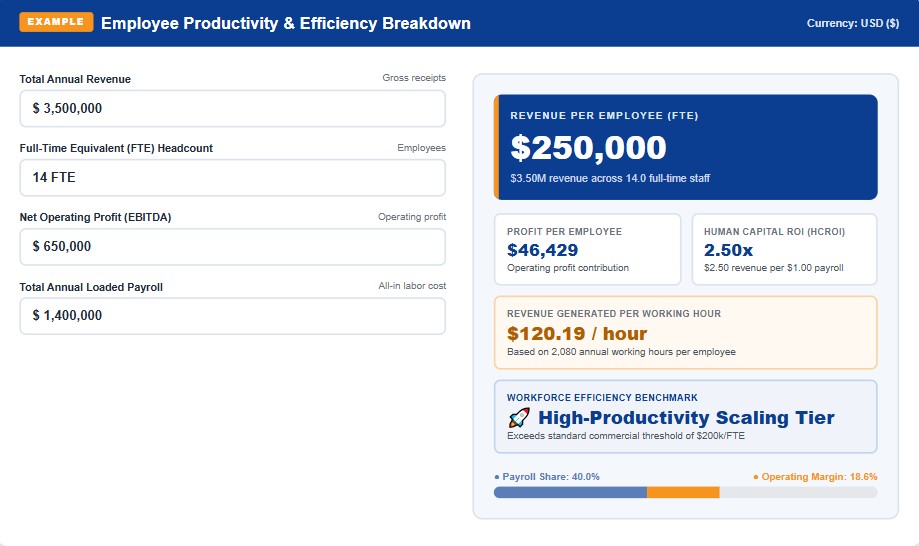
Worked Example: 14-Person Commercial Business Scaling Model
A B2B technical consulting and software firm operates with 14 full-time employees:
- Total Annual Revenue: $3,500,000.
- FTE Headcount: 14.0 employees.
- Net Operating Profit (EBITDA): $650,000 (18.6% Operating Margin).
- Total Loaded Payroll: $1,400,000 ($100,000 average fully loaded cost per employee).
Calculated Productivity Metrics:
- Revenue per Employee: $3,500,000 ÷ 14 = $250,000 per FTE.
- Profit per Employee: $650,000 ÷ 14 = $46,429 net profit per worker.
- Human Capital ROI: $3,500,000 ÷ $1,400,000 = 2.50x HCROI ($2.50 in revenue generated for every $1.00 spent on payroll).
- Hourly Revenue Generation: $250,000 ÷ 2,080 hours = $120.19 revenue per employee hour.
Revenue per Employee Benchmarks by Industry
Workforce productivity varies dramatically based on business models, physical asset requirements, and software automation leverage:
| Industry Sector | Median Revenue / Employee | Top-Quartile Performers | Core Productivity Driver |
|---|---|---|---|
| Software & Cloud (SaaS) | $220,000 – $320,000 | $500,000+ | Zero marginal distribution cost & automation. |
| Financial Services & Banking | $300,000 – $450,000 | $800,000+ | High capital-to-labor ratio & balance sheet scale. |
| Professional & Legal Services | $150,000 – $220,000 | $350,000+ | Billable hour utilization & partner leverage. |
| Commercial Wholesale & Distribution | $250,000 – $400,000 | $700,000+ | High-volume catalog inventory throughput. |
| Retail & Hospitality | $75,000 – $130,000 | $180,000+ | Labor-intensive physical customer service. |
Where to Find Your Numbers
To produce verifiable human capital audits for corporate boards, lenders, or operational reviews, draw from verified corporate records:
- For Fully Loaded Headcount Expenses: Calculate all-in payroll liabilities including taxes and benefits using our Cost per Employee Calculator.
- For Workforce Attrition Costs: Model how turnover rates impact your operational output with our Employee Turnover Calculator.
- For Downside Labor Resilience: Stress-test your payroll overhead against sudden revenue drops using our Business Scenario Calculator.
- For Operating Cash Runway: Ensure hiring plans do not outpace cash reserves with our Burn Rate Calculator.
- For Top-Line Expansion Velocity: Forecast future sales pipelines to plan hiring triggers using our Revenue Forecast Calculator.
What This Calculator Can and Cannot Tell You
What it tells you:
- Average dollar volume of revenue and operating profit generated per full-time seat.
- Human Capital ROI (revenue earned per dollar of payroll invested).
- How your organization compares against macro sector efficiency benchmarks.
What it cannot tell you:
- Individual Contributor Performance: The calculator measures aggregate organizational efficiency; it does not distinguish between a top-performing enterprise account executive and an underperforming back-office clerk.
- Contractor vs. Full-Time Skew: Heavy reliance on outsourced third-party contractors can artificially inflate revenue-per-employee figures if contractor hours are omitted from the FTE count.
- Capital Intensity: Capital-intensive businesses (like commercial real estate or automated manufacturing) produce massive revenue per employee primarily because of machinery and debt, not labor superiority.
Related Guides and Calculators
Master corporate workforce planning, labor economics, and strategic growth with our founder suite:
Frequently Asked Questions
The Bottom Line
Maximizing revenue per employee is the key to scaling an enterprise without suffering administrative bloat. Benchmark your fully loaded payroll with our Cost per Employee Calculator, manage staff retention with our Employee Turnover Calculator, and align sales velocity with our Revenue Forecast Calculator.
- Harvard Business Review: Great Companies Don't Hire More People, They Make People More Productive
- Society for Human Resource Management (SHRM): Human Capital Benchmarking & Productivity Metrics
- U.S. Bureau of Labor Statistics (BLS): Labor Productivity and Costs Industry Reports
- Corporate Finance Institute (CFI): Revenue per Employee & Workforce Efficiency Analysis
Disclaimer: This calculator is provided for strategic planning and educational modeling purposes only. It does not constitute formal management consulting, certified accounting auditing, or executive compensation advice. Tailor operational standards to your specific industry environment.