Quick answer: About 7.9% of Americans, or 26.7 million people, went without health insurance for all of 2025, and nearly half own no life insurance. Gaps are widest where coverage is optional, such as flood insurance. Health premiums are still rising, while car insurance prices fell 5.0% over the year to September 2026.
U.S. insurers wrote about $977 billion in net property and casualty premiums in 2025, according to the National Association of Insurance Commissioners. Add life and health insurers, and the total runs into the trillions.
Yet large gaps remain. Tens of millions of people have no health coverage or no life insurance, and most homes in flood zones have no federal flood policy. At the same time, prices are moving in opposite directions: car insurance is getting cheaper, while health coverage keeps getting more expensive.
This roundup collects the latest insurance statistics for 2026 from government agencies and industry groups, organized by type of coverage, with what each number means for your own budget.
Key Insurance Statistics for 2026
- 7 million people (7.9%) had no health insurance for all of 2025. (Census Bureau)
- $28,303 is the average yearly premium for employer family health coverage in 2026, and workers pay $7,471 of it. (KFF)
- 2 million people were enrolled and paying for Marketplace plans in 2026, down from a record 21.8 million in 2025. (KFF)
- 52% of Americans own life insurance, and 92 million adults say they need it or need more. (LIMRA and Life Happens)
- 4% of drivers were uninsured in 2023, and 33.4% were uninsured or underinsured. (Insurance Research Council)
- 0% was the drop in car insurance prices over the 12 months to September 2026. (Bureau of Labor Statistics)
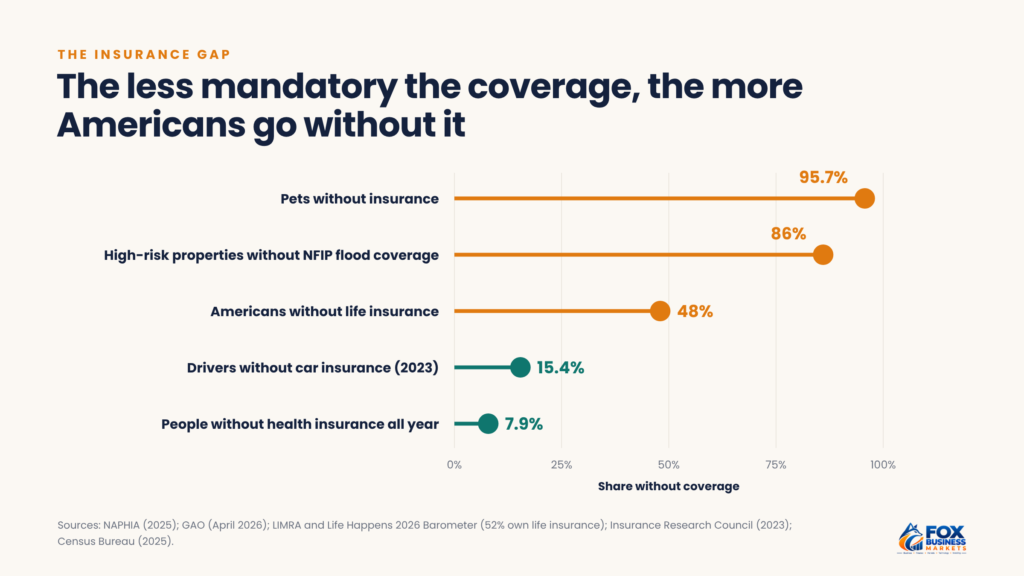
- 86% of high-risk properties had no National Flood Insurance Program coverage as of April 2026. (GAO)
- $100 billion in U.S. insured losses came from natural catastrophes in 2025. (Gallagher Re)
- 27% of U.S. dogs and cats are insured. (NAPHIA)
How Many Americans Have Health Insurance?
Most Americans have health coverage, but the share without it hasn’t budged. In 2025, 26.7 million people, or 7.9% of the population, were uninsured for the entire year, according to the Census Bureau’s Health Insurance Coverage in the United States: 2025, released in September 2026. That rate was not statistically different from 2024.
How people were covered in 2025, for some or all of the year:
Type of coverage | Share of people |
| Employer-based | 53.5% |
| Medicare | 20.1% |
| Medicaid | 17.1% |
| Direct purchase (including Marketplace plans) | 10.5% |
| Any public coverage | 35.8% |
People can have more than one type during the year, so the shares add up to more than 100%.
Among people on Medicare, private plans keep gaining ground. About 35.2 million people, or 55% of eligible Medicare beneficiaries, were in Medicare Advantage plans in 2026, according to KFF.
The next report may look different. Larger, temporary premium tax credits for Marketplace plans expired at the end of 2025, and enrollment has already dropped, as the next section shows.
How Much Does Health Insurance Cost in 2026?
Health coverage keeps getting more expensive, both at work and on the Marketplace.
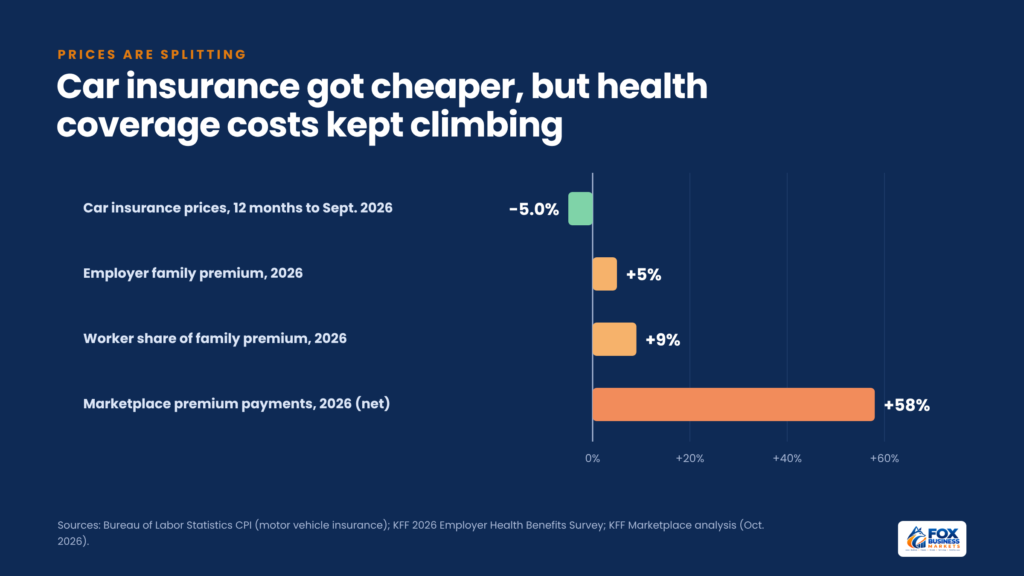
At work. The average annual premium for employer-sponsored family coverage reached $28,303 in 2026, up 5% from 2025, according to KFF’s 2026 Employer Health Benefits Survey. Workers paid $7,471 of that, up 9%. Single coverage averaged $9,804, with workers paying $1,672.
Other numbers from the KFF survey:
- $1,955 was the average deductible for single coverage among workers with a deductible.
- 38% of covered workers with single coverage had a deductible of $2,000 or more.
- $9,687 was the average worker contribution for family coverage at small firms, versus $7,471 overall.
Plan types at work. Half of covered workers, 50%, are in a PPO, according to KFF, followed by HSA-qualified high-deductible plans (29%), HMOs (12%), and POS plans (8%). Most workers face a deductible: 88% of those with single coverage have one.
On the Marketplace. After the enhanced tax credits expired, people who kept the same plan would have paid 114% more on average after tax credits in 2026. Many switched to cheaper plans with higher deductibles, so average premium payments rose 58% on net, and average deductibles rose about 37%, according to KFF. Paid enrollment fell from 21.8 million in 2025 to 19.2 million in 2026, the first decline in seven years.
Out-of-pocket limits. The federal cap on in-network out-of-pocket costs is $10,600 for an individual in 2026 and rises to $12,000 in 2027. The higher those limits go, the more a household needs in an emergency fund to cover a bad year.
How Many Americans Have Life Insurance?
Just over half. In 2026, 52% of Americans own at least one life insurance policy, up 1 point from 2025, according to the 2026 Insurance Barometer Study from LIMRA and Life Happens, two industry groups.
The coverage gap is large:
- 92 millionS. adults say they need life insurance or more of it, including about 70 million who have none.
- About three-quarters of consumers overestimate what life insurance costs.
- 45% of people with a coverage gap cite cost as the reason they haven’t bought, and 35% say other financial priorities come first.
- 27% of insured adults rely only on workplace coverage, 53% have only individual coverage, and 20% have both.
Workplace-only coverage is a risk, because group policies are often limited to one or two times salary and usually end when you leave the job. And not every worker gets it: 59% of private-industry workers had access to employer life insurance in March 2026, according to the Bureau of Labor Statistics.
Sales hit a record anyway. New annualized premium for individual life insurance passed $17.5 billion in 2025, up 10% and a record, according to LIMRA. Whole life new premium rose 7% to a record $6.4 billion, while term life new premium rose 3% to $3.1 billion.
How Many Drivers Are Uninsured?
More than one in seven. An estimated 15.4% of U.S. drivers were uninsured in 2023, and 33.4% were either uninsured or underinsured, according to an Insurance Research Council study released in 2025. The combined rate is up 10 percentage points since 2017.
The highest uninsured rates in 2023:
- Mississippi:2%
- New Mexico:1%
- District of Columbia:1%
Underinsured drivers carry coverage, but often at low state minimums. Most states require $25,000 or less in property damage liability, while the average new vehicle sold for $50,562 in September 2026, according to Kelley Blue Book.
How Much Does Car Insurance Cost?
After years of steep increases, car insurance prices are falling. The Consumer Price Index for motor vehicle insurance was 5.0% lower in September 2026 than a year earlier, according to the Bureau of Labor Statistics. That followed a 5.1% drop in August, the index’s largest 12-month decline since November 2020.
That follows a long climb. The national average combined premium for liability, collision, and comprehensive coverage was $1,438 per vehicle in 2023, up 14.42% from 2022, according to the NAIC’s latest Auto Insurance Database Report, released in February 2026.
Claim costs explain part of the pressure:
- $24,281 was the average bodily injury liability claim for 2022–2024 model-year vehicles. (Highway Loss Data Institute)
- $6,015 was the average property damage liability claim for the same vehicles. (Highway Loss Data Institute)
Your own rate depends on your driving record, car, location, and, in most states, a credit-based insurance score built from your credit history. California, Hawaii, and Massachusetts don’t allow it for car insurance. Keeping a good credit score can help where insurers use it.
What’s Happening With Homeowners Insurance?
Homeowners insurance has become more expensive and harder to keep. Average homeowners premiums per policy rose in every region from 2018 to 2024, by 18.3% to 43.3% after inflation depending on the region, according to an NAIC analysis released in August 2026. That works out to 2.4% to 5.3% a year above inflation.
Insurers also dropped more customers. Company-initiated non-renewal rates rose between 96% and 216% over the same period, depending on the region, the NAIC found. Claim frequency and severity generally increased, especially from 2021 to 2024.
Flood coverage is the biggest gap. Standard homeowners policies don’t cover flood damage, and most at-risk homes have no federal flood policy:
- 86% of high-risk properties had no National Flood Insurance Program coverage as of April 2026, according to a GAO report published in October 2026.
- 5 million NFIP policies were in force in 2026, down from 5.5 million in 2010, according to GAO.
- $52,000 was the average NFIP claim payment from 2019 to 2023, according to FEMA.
- One-third of NFIP claims from 2013 to 2023 came from outside high-risk flood areas.
How Big Were Catastrophe Losses in 2025?
Natural disasters cost insurers about $129 billion worldwide in 2025, according to Gallagher Re’s annual Natural Catastrophe and Climate Report. That was roughly 5% below the 2015–2024 average.
The U.S. carried most of it:
- $100 billion, or 78% of global insured losses, came from U.S. events.
- $41 billion came from the January 2025 Los Angeles wildfires, the year’s largest insured loss.
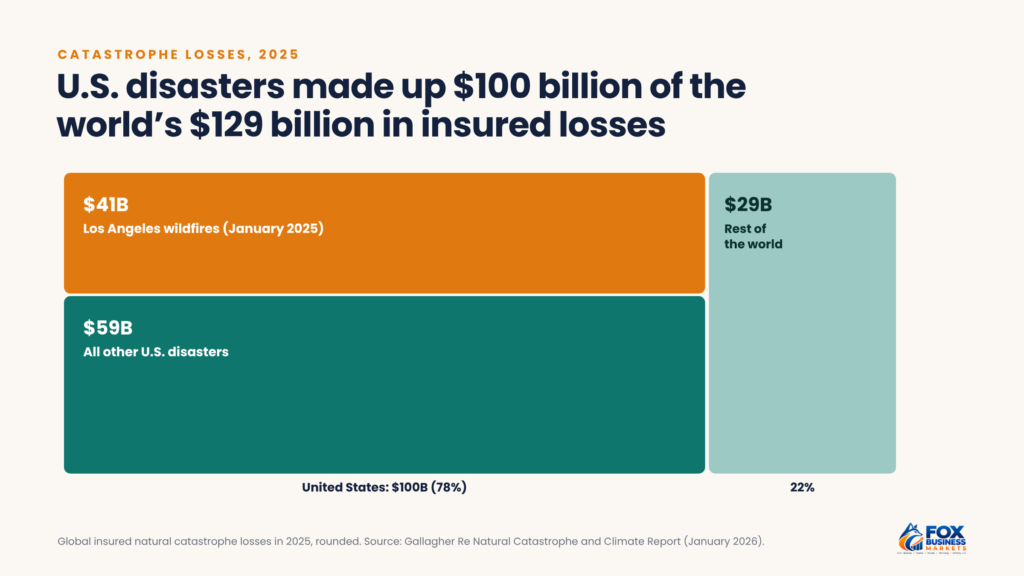
Losses like these feed directly into homeowners premiums and non-renewals, especially in wildfire- and hurricane-prone states.
How Many Workers Get Insurance Through Their Job?
For most families, the job is the main source of coverage, but access varies by benefit. Share of private-industry workers with access to each benefit in March 2026, according to the Bureau of Labor Statistics:
Workplace benefit | Workers with access |
| Medical care | 71% |
| Life insurance | 59% |
| Short-term disability | 44% |
| Long-term disability | 37% |
Access isn’t the same as coverage. Some workers turn down a medical plan because the premium is too high or because they’re covered through a spouse. And workplace life and disability benefits are often set at a fixed multiple of salary, which may fall short of what a family needs.
If your employer offers a benefit for free or at a low group rate, it usually makes sense to take it, then fill any gaps with individual coverage you own yourself.
How Big Is the U.S. Insurance Industry?
U.S. insurers collect trillions of dollars a year. According to the NAIC’s 2025 year-end industry snapshot:
Sector | 2025 figure |
| Property and casualty: net premiums written | $976.8 billion |
| Property and casualty: combined ratio | 92.9% |
| Life and accident & health: direct written premium, including annuities and deposits | $1.51 trillion |
| Health entities (NAIC health filers): direct written premium | $1.37 trillion |
| Health entities: combined ratio | 100.6% |
A combined ratio below 100% means an insurer paid out less in claims and expenses than it earned in premiums. Property and casualty insurers were profitable on their core business in 2025. Health insurers, at 100.6%, had an $8.1 billion underwriting loss, though investment income still left them with about $6 billion in net income.
How Common Are Disability and Pet Insurance?
Disability. About 1 in 4 of today’s 20-year-olds will become disabled before reaching 67, according to the Social Security Administration. In December 2024, 7.2 million disabled workers received Social Security disability benefits.
Workplace disability coverage is far from universal. In March 2026, 44% of private-industry workers had access to short-term disability insurance and 37% to long-term disability insurance, according to the Bureau of Labor Statistics. Everyone else would rely on savings, Social Security, or an individual policy if they couldn’t work.
Pets. Pet insurance is growing fast but still rare. About 7 million U.S. dogs and cats were insured at the end of 2025, up 9% from 2024, according to the North American Pet Health Insurance Association’s 2026 State of the Industry report. That’s only 4.27% of dogs and cats. Premiums in force rose 19.7% to about $5.7 billion. Average accident and illness premiums were $836 a year for dogs and $435 for cats.
Where Are the Biggest Insurance Gaps?
The pattern across these numbers is consistent: the less mandatory the coverage, the bigger the gap. Health and car insurance, which most people get through a job, a government program, or a legal requirement, reach the large majority. Life, flood, disability, and pet coverage, which people must choose and pay for themselves, reach far fewer.
Are Insurance Prices Really Going Down?
Only for some types. The recent drop in car insurance prices is real, but it follows several years of double-digit increases, so many drivers still pay far more than they did in 2021. And the national index won’t match your renewal: rates vary widely by state, insurer, and driver.
Health and home coverage are moving the other way. Employer family premiums rose 5% in 2026, Marketplace enrollees paid 58% more on net, and homeowners premiums have outpaced inflation in every region from 2018 to 2024.
Shop your car insurance at renewal to capture lower prices, and plan for higher health and homeowners costs. Build both into your monthly budget.
Frequently Asked Questions
What is the most common type of insurance in the U.S.?
Health insurance covers the most people, with about 92% of Americans insured for at least part of 2025. Car insurance is required in nearly every state, so most drivers carry it too. Check that your own core policies, health, auto, and home or renters, are in place before adding extras.
Why have insurance premiums risen so much?
The main drivers are higher claim costs: pricier medical care, more expensive car repairs and parts, rising home rebuilding costs, and larger disaster losses. Insurers also price in lawsuits and reinsurance costs, which they pass on to customers. Car insurance prices have started to ease, but health and home costs have not. Compare quotes from several insurers at renewal, since prices for the same coverage can vary widely.
Should I buy uninsured motorist coverage?
Uninsured and underinsured motorist coverage pays your injury costs, and in some states your car repairs, when an at-fault driver has no insurance or too little. Some states require it, and many others require insurers to offer it. Set your limits to match your own liability limits, since the added cost is usually small.
How much life insurance do I need?
A common rule of thumb is about 10 times your annual income, adjusted for your mortgage, other debts, your children’s future costs, and savings you already have. Add up what your family would need, subtract existing coverage, including workplace policies, and buy term life insurance to cover the difference.
Check Your Own Coverage Against These Numbers
Use these insurance statistics as a checklist for your household. Confirm you have health coverage that fits your budget, enough life insurance for anyone who depends on your income, liability limits above your state’s minimum, and flood coverage if you live near water. Our overview of the types of insurance explains each policy, and our personal finance statistics roundup shows how insurance fits into the bigger picture of household money.
This article is for general information only and isn’t financial, legal, or insurance advice. Policies and rules vary by insurer and state, so read your policy and talk to a licensed professional before making decisions.