
Two government reports released twelve days apart this fall tell the story of American money in 2026. On October 9, the Federal Reserve reported that the typical family’s net worth reached $215,900 in 2025, a 2% gain after inflation since 2022. On October 21, the Bureau of Labor Statistics reported that median weekly pay for full-time workers was up 1.5% from a year earlier, while consumer prices were up 3.5% over the same period. Wealth is inching up on paper. Paychecks are falling behind prices.
This roundup collects the latest personal finance statistics from official sources, including the Federal Reserve, the Census Bureau, the Bureau of Labor Statistics, and the New York Fed. Every number includes its source and date, so you can check it yourself.
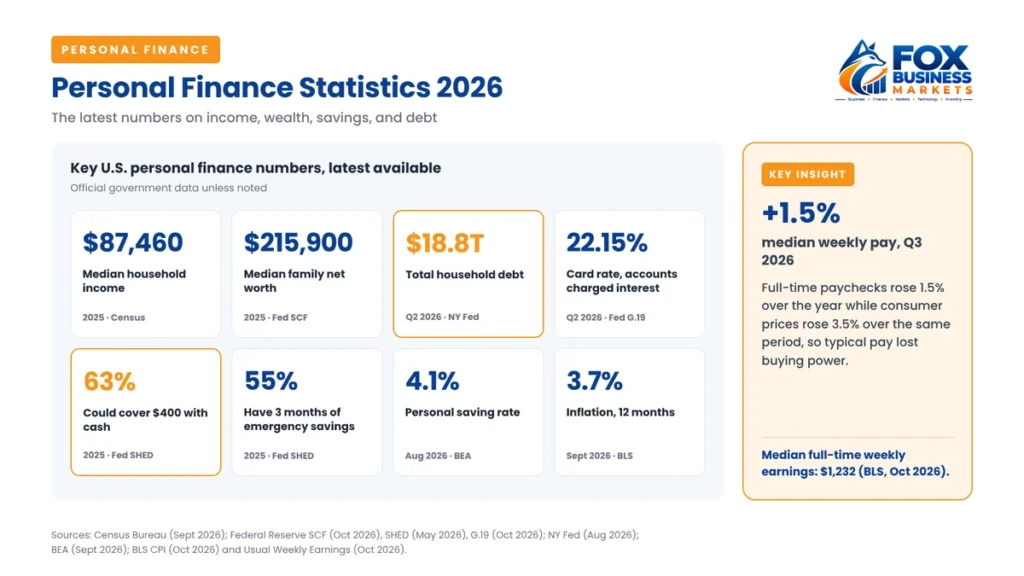
Quick answer: In 2026, median U.S. household income is $87,460 (2025 data), median family net worth is $215,900, and household debt totals $18.8 trillion, including $1.26 trillion on credit cards. Sixty-three percent of adults could cover a $400 emergency with cash, and 55% have three months of emergency savings. The personal saving rate was 4.1% in August 2026.
Personal Finance Statistics at a Glance
These are the headline personal finance statistics for 2026, with the latest available data for each.
| Statistic | Latest figure | Source and date |
| Median household income | $87,460 (2025), up 2.6% | Census Bureau, Sept 2026 |
| Median weekly earnings, full-time workers | $1,232 (Q3 2026), up 1.5% | BLS, Oct 2026 |
| Inflation (CPI, 12 months) | 3.7% (Sept 2026) | BLS, Oct 2026 |
| Personal saving rate | 4.1% (Aug 2026) | BEA, Sept 2026 |
| Median family net worth | $215,900 (2025) | Federal Reserve SCF, Oct 2026 |
| Total household debt | $18.8 trillion (Q2 2026) | New York Fed, Aug 2026 |
| Credit card balances | $1.26 trillion (Q2 2026) | New York Fed, Aug 2026 |
| Average credit card rate (accounts charged interest) | 22.15% (Q2 2026) | Federal Reserve G.19, Oct 2026 |
| Adults who’d cover a $400 emergency with cash | 63% (2025) | Federal Reserve SHED, May 2026 |
| Adults with three months of emergency savings | 55% (2025) | Federal Reserve SHED, May 2026 |
| Adults “doing at least okay” financially | 73% (2025) | Federal Reserve SHED, May 2026 |
| Homeownership rate | 65.0% (Q2 2026) | Census Bureau, July 2026 |
| Official poverty rate | 10.2% (2025) | Census Bureau, Sept 2026 |
| Average FICO Score | 714 (April 2026) | FICO (vendor data), Aug 2026 |
How Much Do Americans Earn in 2026?
Median household income was $87,460 in 2025, an increase of 2.6% after inflation from $85,210 in 2024, according to the Census Bureau’s income, poverty, and health insurance release from September 2026. Median means half of households earned more and half earned less.
Paychecks in 2026 are a different story. The Bureau of Labor Statistics’ Usual Weekly Earnings report found that the nation’s 122.2 million full-time wage and salary workers had median weekly earnings of $1,232 in the third quarter of 2026. That was 1.5% higher than a year earlier, “compared with a gain of 3.5 percent in the Consumer Price Index for All Urban Consumers (CPI-U)” over the same period. (The 3.5% compares the third quarter with a year earlier; the September 12-month CPI change was 3.7%.) In other words, the typical full-time paycheck lost buying power over the past year.
The gender gap persists. Women working full time had median weekly earnings of $1,127, compared with $1,352 for men, or 83.4% of men’s earnings.
Poverty fell slightly. The official poverty rate dropped 0.5 percentage points to 10.2% in 2025. The Supplemental Poverty Measure, which accounts for taxes, government benefits, and expenses like medical costs, was 13.1%. And 26.7 million people, 7.9% of the population, had no health insurance for the entire year.
How Much Are Americans Spending?
The average U.S. household (what the BLS calls a “consumer unit”) spent $78,535 in 2024, up 1.8% from 2023, according to the Bureau of Labor Statistics’ Consumer Expenditures in 2024 report. Housing took 33.4% of that spending, transportation 17.0%, food 12.9%, personal insurance and pensions 12.5%, and healthcare 7.9%.
Prices are rising faster again. Consumer prices rose 3.7% in the 12 months ending September 2026, according to the BLS Consumer Price Index. Energy prices jumped 20.4%, led by gasoline at 34.2%. Groceries rose a milder 1.8%, restaurant meals 3.5%, and shelter 3.2%. Motor vehicle insurance fell 5.0%. For a practical look at how to handle these changes, see our guide on how to make a budget.
How Much Do Americans Have in Savings?
Savings are where personal finance statistics show the widest gaps. Most Americans have some cushion, but a large minority is one surprise away from trouble. The personal saving rate, personal saving as a share of disposable income, was 4.1% in August 2026, according to the Bureau of Economic Analysis’ Personal Income and Outlays release. That’s below the 2025 annual rate of 5.4%, as published in BEA data on the St. Louis Fed’s FRED database.
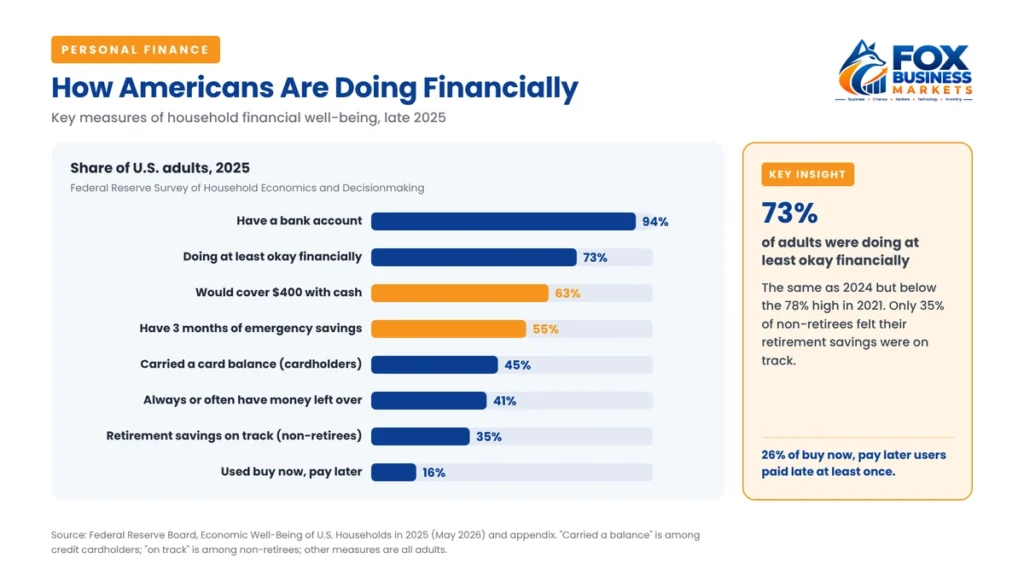
The Federal Reserve’s Economic Well-Being of U.S. Households in 2025 survey, published in May 2026, adds detail:
- 63% of adults would cover a hypothetical $400 emergency expense entirely with cash or its equivalent, unchanged since 2022 and below the 68% peak in 2021.
- 12% said they wouldn’t be able to pay a $400 expense right now by any means.
- 55% had set aside money for three months of expenses, ranging from 21% of adults with family income under $25,000 to 75% of those earning $100,000 or more.
- 41% said they always or often had money left over at the end of the month.
- 59% had at least one major, unexpected expense in the prior year, most often a vehicle repair (30%).
Among families with a transaction account (checking, savings, money market or call accounts, or prepaid debit cards), the median balance was $8,200 in 2025, down 6% from 2022 after inflation, according to the Federal Reserve’s Survey of Consumer Finances. If your own cushion is thin, our guide to building an emergency fund walks through the steps.
How Much Debt Do Americans Have?
Debt is the most-watched set of personal finance statistics. Total household debt was $18.8 trillion in the second quarter of 2026, according to the New York Fed’s Household Debt and Credit Report. That was down $13 billion from the first quarter but up $383 billion from a year earlier.
| Debt type | Balance, Q2 2026 |
| Mortgages | $13.12 trillion |
| Auto loans | $1.71 trillion |
| Student loans | $1.65 trillion |
| Credit cards | $1.26 trillion |
| Other | $0.57 trillion |
| Home equity lines of credit | $0.46 trillion |
| Total | $18.77 trillion |
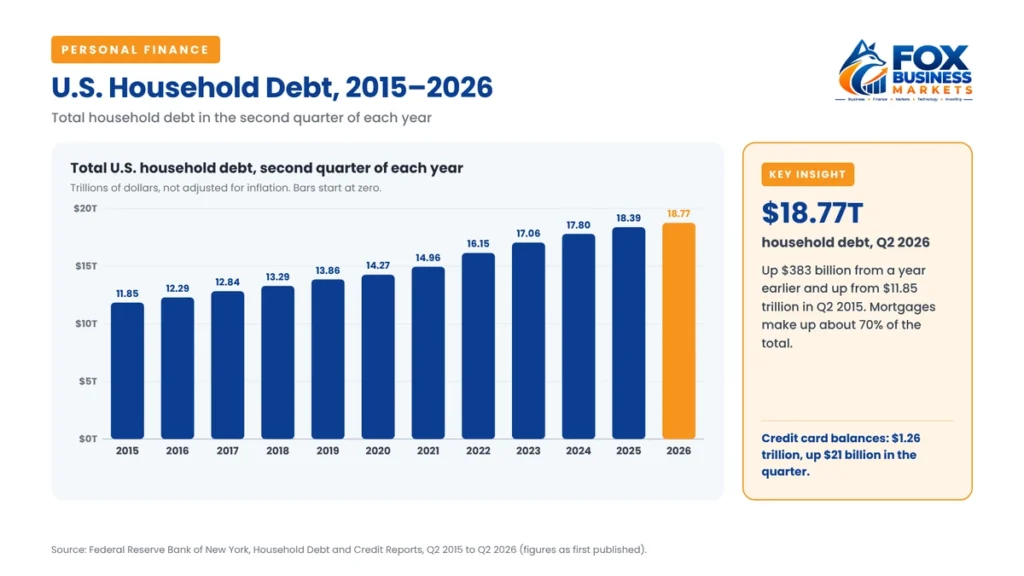
Credit card balances rose $21 billion in the quarter. And credit card debt is expensive: the average rate at commercial banks on accounts assessed interest was 22.15% in the second quarter of 2026, according to the Federal Reserve’s G.19 report.
Late payments remain a concern. The New York Fed reported that 4.7% of household debt was in some stage of delinquency. Credit card balances moved into serious delinquency (90+ days late) at an annualized rate of 6.97%, up slightly from 6.93% a year earlier.
Among credit cardholders, 45% carried a balance at least once in the past year, according to the Fed’s 2025 household survey. Buy now, pay later (BNPL) continues to grow: 16% of adults used it in 2025, and 26% of BNPL users said they had paid late at least once. Our guide on how to pay off debt compares the best payoff strategies.
What Is the Average American’s Net Worth?
The median U.S. family had a net worth of $215,900 in 2025, a 2% increase after inflation since 2022, according to the Federal Reserve’s Survey of Consumer Finances, released October 9, 2026. Net worth is everything a family owns (home equity, savings, retirement accounts, investments) minus everything it owes.
The average (mean) net worth was much higher: $1,241,500, up 7% after inflation since 2022. The gap between the median and the mean shows how concentrated wealth is. A relatively small number of very wealthy families pull the average far above what the typical family has. When someone quotes the “average American’s net worth,” check which number they mean.
How Much Do Americans Have Saved for Retirement?
About 55% of families (54.9%) had a retirement account such as a 401(k) or IRA in 2025, according to the Survey of Consumer Finances. Among families that had one, the median balance was $106,000, up 11% after inflation since 2022. (The Fed’s separate figure of about 65% “retirement plan participation” also counts pensions and covers families headed by someone 64 or younger.)
Confidence is lower than the balances suggest. Only 35% of adults who aren’t yet retired thought their retirement savings plan was on track, according to the Fed’s 2025 household survey.
For 2026, the IRS allows up to $24,500 in employee contributions to a 401(k), 403(b), or governmental 457 plan, plus an $8,000 catch-up for workers 50 and older ($11,250 for ages 60 to 63). The IRA limit is $7,500, plus a $1,100 catch-up for those 50 and older. And Social Security benefits will rise 3.6% in January 2027, according to the Social Security Administration.
How Many Americans Own a Home or Have a Bank Account?
The U.S. homeownership rate was 65.0% in the second quarter of 2026, according to the Census Bureau’s Housing Vacancies and Homeownership report. That’s virtually the same as a year earlier. Third-quarter data is scheduled for release on October 28, 2026.
Most adults are banked. Ninety-four percent of adults had a bank account in 2025, according to the Fed’s household survey. The FDIC’s most recent National Survey of Unbanked and Underbanked Households, from 2023, found that 4.2% of U.S. households, about 5.6 million, were unbanked.
The national average FICO Score was 714 as of April 2026, down one point from a year earlier, according to FICO’s (vendor data) Score Credit Insights report from August 2026.
Which Personal Finance Statistics Should You Stop Repeating?
Some personal finance statistics are quoted constantly long after they’ve gone stale or been misread.
“78% of Americans live paycheck to paycheck.” This came from a 2017 CareerBuilder survey of full-time private-sector workers, not all Americans, and it measured how people felt nearly a decade ago. It isn’t a current national statistic.
“Four in ten Americans can’t cover a $400 emergency.” This figure comes from the Fed’s surveys of 2015 to 2018, when 39% to 46% of adults said they wouldn’t cover a $400 expense with cash or its equivalent; many of them would still have paid by card or by borrowing. In 2025, 37% of adults wouldn’t cover a $400 expense entirely with cash or its equivalent, but most of them would still pay some other way, such as a credit card or a loan from family. Only 12% said they couldn’t pay at all.
“The average American has $X in savings.” Averages are pulled up by wealthy households. The median, the middle family, is usually a better guide. For example, median family net worth was $215,900 in 2025, while the mean was more than $1.2 million.
What Do These Personal Finance Statistics Mean for You?
These numbers describe the country, not your household. But they point to a few clear lessons:
- Prices are outrunning paychecks for many workers right now, so review your budget, especially gas and utilities.
- Credit card interest is expensive. At 22% or more, paying down card balances is one of the highest guaranteed returns available.
- Emergency savings separate “doing okay” from struggling. The households that could absorb a $400 surprise or three months without income are better positioned to avoid high-cost debt.
- Retirement savings are growing, but confidence isn’t. Use the 2026 contribution limits to automate more savings if you can.
For the full framework behind these lessons, see our personal finance guide.
Frequently Asked Questions
What is the median household income in the U.S. in 2026?
The latest official figure is $87,460 for 2025, released by the Census Bureau in September 2026. That was up 2.6% after inflation from 2024. Median weekly earnings for full-time workers were $1,232 in the third quarter of 2026, up 1.5% from a year earlier, while consumer prices rose 3.5% over the same period.
How much debt does the average American household have?
Total U.S. household debt reached $18.8 trillion in the second quarter of 2026, according to the New York Fed. Mortgages account for about $13.1 trillion of that, followed by auto loans at $1.7 trillion, student loans at $1.65 trillion, and credit cards at $1.26 trillion. Individual household debt varies widely by age and income.
What percentage of Americans have an emergency fund?
According to the Federal Reserve, 55% of adults had set aside money to cover three months of expenses in 2025. The share ranged from 21% of adults with family income under $25,000 to 75% of those earning $100,000 or more. Sixty-three percent could cover a $400 emergency entirely with cash or its equivalent.
What is the median net worth in the U.S.?
The median U.S. family had a net worth of $215,900 in 2025, according to the Federal Reserve’s Survey of Consumer Finances, released in October 2026. That’s up 2% after inflation since 2022. The mean was $1,241,500, much higher because a small number of very wealthy families raise the average.
What is the personal saving rate in 2026?
The personal saving rate was 4.1% of disposable income in August 2026, according to the Bureau of Economic Analysis. That’s below the 2025 annual rate of 5.4%. The rate measures saving across the whole economy, so it doesn’t tell you how much any individual household is saving.
How much do Americans have saved for retirement?
About 55% of families had a retirement account such as a 401(k) or IRA in 2025, and the median balance among those families was $106,000, according to the Federal Reserve. Only 35% of non-retired adults thought their retirement savings were on track, according to the Fed’s 2025 household survey.
The Bottom Line
The personal finance statistics for 2026 show a split picture. Families are slightly wealthier on paper, with median net worth at $215,900 and retirement balances up. But paychecks have trailed inflation over the past year, credit card balances keep climbing at rates above 22%, and more than a third of adults wouldn’t cover a $400 surprise entirely with cash.
The October reports that opened this article point in the same direction: progress is real, but it’s uneven and fragile. The most useful thing you can do with these numbers is compare them to your own. Know your income, your savings cushion, your debt rates, and your net worth, and you’ll know which of these trends is working for you and which is working against you. We’ll update this page as new data arrives, including the New York Fed’s third-quarter debt report expected in November.