Free Team Capacity Calculator: Calculate Billable Hours & Utilization
This free team capacity calculator determines your team's true productive delivery hours by factoring in paid time off (PTO), statutory holidays, internal administrative overhead, and target billable utilization rates. It enables project managers, agency founders, and software engineering leads to balance workloads and commit to realistic project deadlines without burning out staff.
Who it's for: Project managers, scrum masters, agency directors, professional services leads, and engineering managers planning upcoming client deliverables, quarters, or agile sprints.
Why use it:
- Prevent Project Overcommitment: Stop assuming 40 billable hours per employee per week. Realistic models account for meetings, administrative tasks, and vacation days.
- Track Billable Utilization Rates: Benchmark billable client hours against total paid time to maintain agency gross profit margins above 50%.
- Determine True Hiring Triggers: Quantify when your current team capacity reaches maximum utilization (80%+) before client deadlines slip.
How to Use the Team Capacity Calculator
- Enter Team Scale: Input the total number of full-time equivalent (FTE) team members available for project work.
- Set Standard Weekly Hours: Input the standard contracted hours per team member (typically 40 hours per week).
- Choose the Planning Horizon: Select your planning interval: a 2-week agile sprint, a 4-week monthly cycle, an 8-week deliverable phase, or a 12-week fiscal quarter.
- Deduct Paid Time Off (PTO) & Holidays: Enter the cumulative number of vacation days, sick leave, and statutory public holidays across the entire team for that period.
- Factor in Administrative Overhead: Specify the average hours per week each member spends on internal meetings, standups, email management, and non-billable corporate syncs.
- Review Net Deliverable Capacity: Inspect total gross available hours, net deliverable project hours, weekly velocity, and team workload resilience status.
How It Works & Team Capacity Formulas
Accurate workload planning separates nominal paid time from actual delivery capacity:
The 100% capacity trap is the primary reason software sprints fail and agency deliverables are delayed. In practice, knowledge workers cannot sustain more than 30 to 34 deep project hours per week without seeing quality decline and error rates surge.
Worked Example: 6-Person Cross-Functional Team (4-Week Cycle)
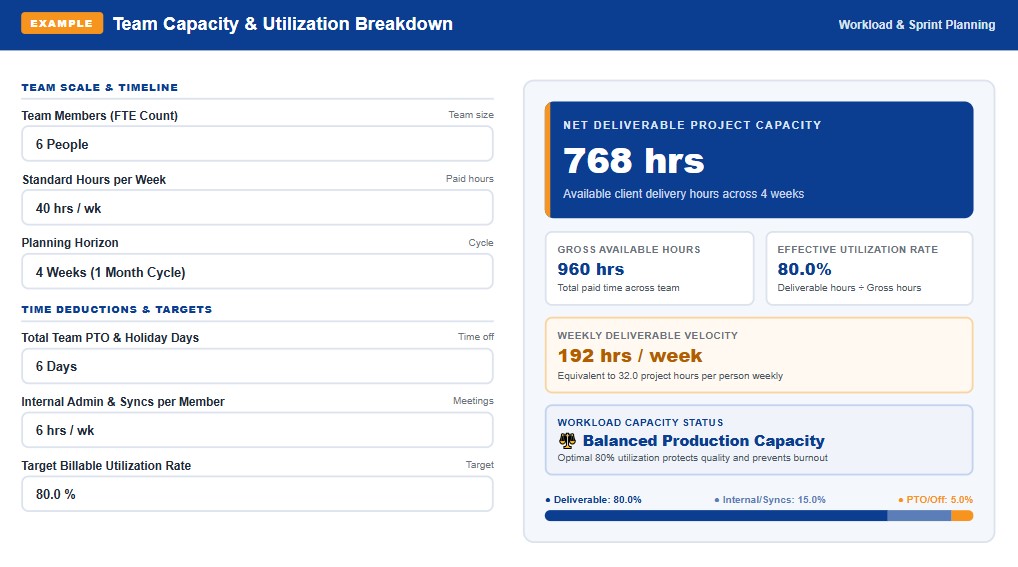
A digital product agency plans deliverables for a 6-person cross-functional team over a 4-week monthly cycle:
- Team Members: 6 full-time specialists (engineers, designers, product managers).
- Standard Workweek: 40 hours per week.
- Gross Available Time: 6 people × 40 hrs × 4 weeks = 960 gross paid hours.
- Team Time Off: 6 total planned PTO/holiday days across the team (6 days × 8 hrs = 48 hours).
- Internal Administrative Syncs: 6 hours per person weekly (6 people × 6 hrs × 4 weeks = 144 hours).
Calculated Capacity & Utilization:
- Total Non-Billable Deductions: 48 PTO hrs + 144 admin hrs = 192 hours.
- Net Deliverable Project Capacity: 960 − 192 = 768 deliverable hours.
- Effective Billable Utilization: (768 ÷ 960) × 100 = 80.0% Utilization Rate.
- Weekly Production Velocity: 768 hrs ÷ 4 weeks = 192 hours/week (32.0 project hours per person weekly).
Project Manager Insight: Committing the client to 960 hours of scope would have resulted in an unmanageable 192-hour delivery deficit. Scheduling exactly 768 hours ensures project delivery on budget and on schedule.
Team Utilization Benchmarks: What is Realistic?
Target utilization rates differ significantly depending on seniority, role specialization, and client interaction levels:
| Role / Specialization Level | Healthy Target Utilization | Deliverable Hrs / Week | Expected Overhead Allocation |
|---|---|---|---|
| Individual Contributors (Dev / Design) | 80% – 85% | 32 – 34 hrs / wk | Standups, documentation, sprint planning. |
| Senior Specialists & Tech Leads | 70% – 75% | 28 – 30 hrs / wk | Code reviews, architectural specs, mentoring. |
| Project & Product Managers | 50% – 60% | 20 – 24 hrs / wk | Client management, backlog grooming, demos. |
| Executive Leadership & Directors | 20% – 40% | 8 – 16 hrs / wk | Sales proposals, corporate strategy, HR audits. |
Where to Find Your Numbers
To produce institutional-grade capacity forecasts for client proposals, project roadmaps, and hiring budgets, integrate reliable operational data:
- For Loaded Labor Costs: Determine the exact hourly cost of staff being assigned to projects with our Cost per Employee Calculator.
- For Commercial Productivity Benchmarks: Measure revenue generated per delivered hour using our Employee Productivity Calculator.
- For Hiring Timing & Attrition: Plan for team turnover and recruitment replacement timeframes using our Employee Turnover Calculator.
- For Project Pricing & Billable Margins: Protect agency profitability on fixed-fee client scopes with our Pricing Strategy Calculator.
- For Operating Cash Flow Protection: Monitor your company runway before onboarding additional capacity with our Burn Rate Calculator.
What This Calculator Can and Cannot Tell You
What it tells you:
- Realistic net available project hours after deducting planned time off and internal syncs.
- Your team's true effective utilization rate compared against healthy industry benchmarks.
- The sustainable weekly delivery velocity your project leads can commit to.
What it cannot tell you:
- Context Switching & Multitasking Friction: Working on 4 different client projects simultaneously introduces task-switching friction that can reduce true intellectual output by 20% to 40%.
- Individual Contributor Skill Asymmetry: A senior software engineer may complete a complex feature in 6 hours that takes a junior developer 25 hours. Capacity measures time, not skill leverage.
- Unplanned Work & Urgent Bug Fixes: The calculator assumes planned workloads; it does not automatically model emergency client escalations or unscheduled critical outages.
Related Guides and Calculators
Master project resourcing, team productivity, and commercial operations with our founder suite:
Frequently Asked Questions
The Bottom Line
Predictable project delivery begins with disciplined capacity planning. Match your available delivery hours with verified billing rates using our Cost per Employee Calculator, audit team revenue contribution with our Employee Productivity Calculator, and prevent operational bottlenecks before they impact your clients.
- Project Management Institute (PMI): Resource Management & Capacity Planning Standards (PMBOK)
- Scrum Alliance: Sprint Planning: Calculating Real Team Capacity vs. Velocity
- Harvard Business Review: The High Cost of Multitasking and Overloaded Workforces
- Service Performance Insight (SPI): Professional Services Maturity Benchmark & Utilization Guidelines
Disclaimer: This calculator is provided for operational planning and educational modeling purposes only. It does not constitute formal workforce scheduling agreements, labor union advisory, or contractual client commitments. Adjust delivery estimates based on empirical project tracking.