How to Use the Customer Lifetime Value Calculator
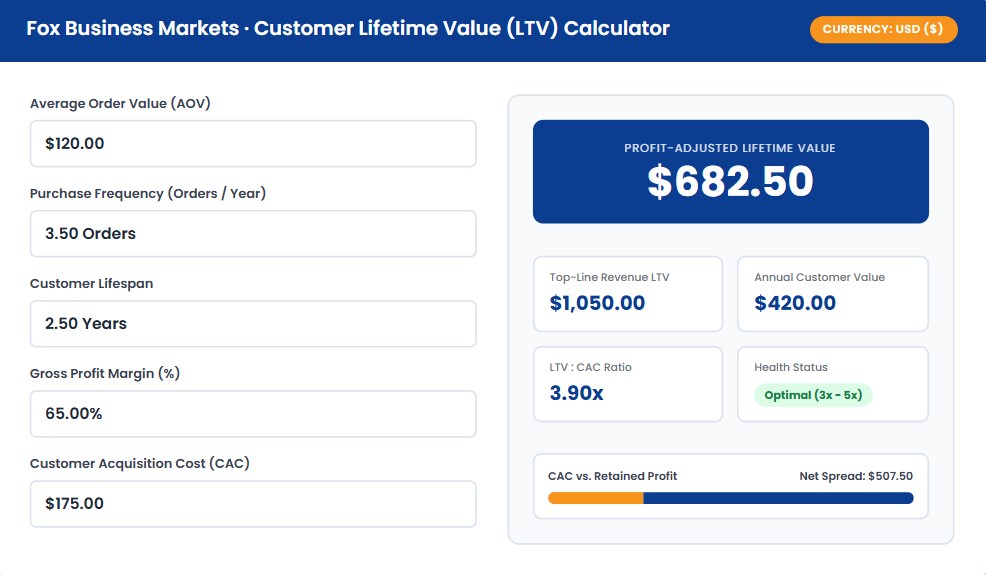
Follow these simple steps to calculate your true unit economics and evaluate acquisition health:
- Select Currency: Choose your operational currency (USD, GBP, EUR, CAD, or AUD) from the header selector.
- Average Order Value (AOV): Enter the average gross amount a customer spends during a single transaction or billing cycle.
- Purchase Frequency: Enter the average number of repeat purchases or billing events completed per customer per year.
- Customer Lifespan: Enter the average number of years a customer remains active before churning.
- Gross Profit Margin (%): Input your gross margin percentage after deducting Cost of Goods Sold (COGS) and direct fulfillment expenses.
- Customer Acquisition Cost (CAC): Enter your blended acquisition cost per user to immediately benchmark your LTV:CAC ratio.
How It Works & Core Mathematical Formulas
Customer Lifetime Value can be viewed through two distinct lenses: Top-Line Revenue LTV and Profit-Adjusted Contribution LTV. For financial planning and cash preservation, only the profit-adjusted model provides actionable guidance.
1. Annual Customer Value
Customer Value (Annual) = Average Order Value (AOV) × Purchase Frequency (PF)
2. Top-Line Revenue LTV
Revenue LTV = Annual Customer Value × Customer Lifespan (t)
3. Profit-Adjusted Real LTV
Profit LTV = Revenue LTV × Gross Profit Margin (%)
4. Churn-Based Lifespan Formula (SaaS & Subscriptions)
Customer Lifespan (Years) = 1 / Annual Customer Churn Rate
Fully Worked Numerical Example
Consider an expanding Direct-to-Consumer (D2C) brand with the following operating figures:
- AOV: $60 per order
- Purchase Frequency: 6 purchases per year
- Average Lifespan: 3 years
- Gross Profit Margin: 60%
- Blended CAC: $120 per customer
Step 1: Annual Customer Revenue = $60 × 6 = $360 per year
Step 2: Top-Line Revenue LTV = $360 × 3 years = $1,080
Step 3: Profit-Adjusted LTV = $1,080 × 60% = $648.00
Step 4: LTV:CAC Ratio = $648 / $120 = 5.40x
This result confirms that each $120 acquisition spend generates $648 in net gross profit contribution—representing a viable, highly scalable marketing engine.
Industry Benchmarks for LTV & LTV:CAC
| Business Model | Avg. Lifespan | Target Gross Margin | Benchmark LTV:CAC |
|---|---|---|---|
| B2B Enterprise SaaS | 4 - 7 Years | 75% - 85% | 3.0x - 5.0x |
| D2C / E-Commerce | 1.5 - 3 Years | 45% - 65% | 2.5x - 4.0x |
| Consumer Subscription | 14 - 24 Months | 65% - 75% | 3.0x - 3.5x |
| Professional Agencies | 2 - 4 Years | 50% - 60% | 4.0x - 6.0x |
Where to Find Your Numbers
Collect and cross-reference your inputs from existing business reports and our suite of financial tools:
- Average Order Value (AOV): Export "Total Net Sales ÷ Total Completed Orders" from Shopify, WooCommerce, or Stripe. To optimize this metric, use our Pricing Strategy Calculator.
- Purchase Frequency & Lifespan: Run cohort retention reports in your CRM (HubSpot, Salesforce, or Klaviyo).
- Customer Acquisition Cost (CAC): Divide aggregate marketing and ad spend by total new customers acquired. To calculate accurate blended vs. paid CAC, use our Customer Acquisition Cost (CAC) Calculator.
- Campaign ROAS Benchmarks: Determine campaign-level return thresholds using our ROAS Calculator.
What This Calculator Can and Cannot Tell You
- True gross-profit contribution per acquired customer
- Whether your growth model is over-investing or burning excess capital on ads
- Baseline unit economics needed to model healthy payback windows
- Cash flow timing and working capital collection delays
- Non-linear cohort decay and seasonal purchase shifts
- Fixed general and administrative (G&A) operational overhead
Related Calculators & Resources
Frequently Asked Questions
What is the difference between Revenue LTV and Gross Profit LTV?
Revenue LTV counts total billings without factoring in the direct costs required to deliver products or services. Gross Profit LTV deducts COGS, revealing the actual net contribution available to pay down acquisition costs and fixed overhead.
What is an ideal LTV:CAC ratio?
A 3.0x to 4.0x ratio is generally considered the gold standard for profitable, scalable growth. Ratios below 1.5x indicate unsustainable acquisition burning capital, while ratios above 5.0x often suggest under-investment in addressable market capture.
How do I estimate customer lifespan without historical data?
For recurring and subscription models, use the standard inverse churn formula: Customer Lifespan = 1 / Annual Churn Rate. For instance, a 20% annual churn translates to an average lifespan of 5 years (1 / 0.20).
Authoritative References & Methodologies:
- Harvard Business Review: The Value of Keeping the Right Customers (Gallo, A.)
- Bain & Company: Prescription for Cutting Costs - The Economics of Customer Loyalty (Reichheld, F.)