ROAS Calculator: Return on Ad Spend & Break-Even ROAS
This free ROAS calculator determines your Return on Ad Spend (ROAS) as both a multiplier and a percentage, while identifying your exact break-even ROAS based on your product's gross profit margin. It helps performance marketers, media buyers, and e-commerce founders evaluate campaign profitability across Meta Ads, Google Ads, TikTok Ads, and Amazon PPC.
Who it's for: E-commerce brand operators, performance marketing agencies, media buyers, growth directors, and Amazon sellers scaling paid acquisition campaigns.
Why use it:
- Identify True Break-Even ROAS: Avoid scaling ad campaigns that look profitable on ad platforms but actually lose cash after deducting product COGS and merchant fees.
- Calculate Net Profit After Ad Spend: Measure exact bottom-line dollar earnings remaining after paying direct ad spend and fulfillment costs.
- Plan Ad Budgets for Revenue Goals: Reverse-engineer the precise advertising budget required to achieve specific monthly gross revenue milestones.
How to Use the ROAS Calculator
- Select Analysis Mode:
- Choose Campaign Performance Analysis to evaluate historical results from an active ad campaign (Meta, Google, TikTok, Amazon).
- Choose Target ROAS Budget Planner to determine the maximum allowable ad spend required to achieve a gross revenue goal at a specific target efficiency.
- Enter Total Advertising Spend: Input the gross cash amount invested in paid advertising over your chosen period (daily, weekly, monthly).
- Input Attributed Ad Revenue: Enter the total top-line sales attributed directly to those advertising campaigns.
- Set Product Gross Profit Margin: Input your average gross margin percentage before ad costs (revenue minus cost of goods sold, shipping, and payment processing fees).
- Review Strategic Performance Metrics: Inspect your ROAS multiplier, break-even ROAS hurdle, net profit after advertising, and scaling verdict.
How It Works: ROAS & Break-Even Formulas
Return on Ad Spend measures the gross revenue generated for every dollar spent on paid advertising, while break-even ROAS ensures you never scale unprofitable marketing:
The ROAS Vanity Trap: A 2.5x ROAS sounds impressive on an ad dashboard, but if your product has a 35% gross profit margin, your break-even ROAS is 2.86x ($100 ÷ 35). At 2.5x, your company actually loses money on every customer order once manufacturing, packaging, and shipping are fulfilled.
Worked Example: E-Commerce Campaign Scaling Analysis
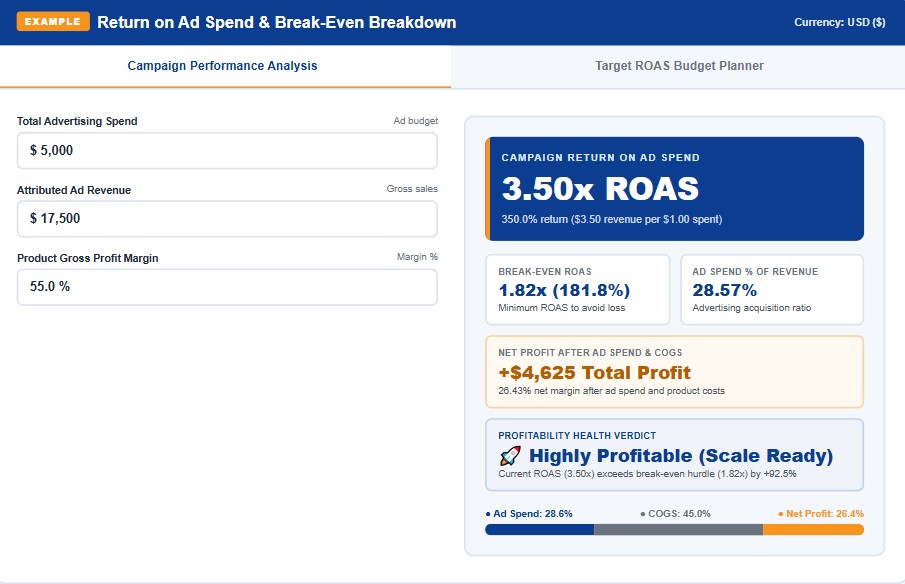
A direct-to-consumer apparel brand runs a 30-day Meta Ads campaign with a 55% gross profit margin:
- Total Ad Spend: $5,000 on Facebook and Instagram Ads.
- Attributed Ad Revenue: $17,500 in tracked Shopify sales.
- Product Gross Margin: 55.0% (after COGS, merchant fees, and packaging).
Calculated Campaign Output:
- Campaign ROAS: $17,500 ÷ $5,000 = 3.50x ROAS (350.0%).
- Break-Even ROAS: 100 ÷ 55.0% = 1.82x ROAS (181.8%).
- Gross Profit Generated: $17,500 × 55.0% = $9,625 gross contribution.
- Net Profit After Ad Spend: $9,625 − $5,000 = +$4,625 Total Profit (26.43% net margin).
- Ad Spend % of Sales: ($5,000 ÷ $17,500) × 100 = 28.57%.
Strategic Verdict: Because the campaign's 3.50x ROAS significantly exceeds its 1.82x break-even requirement by +92.5%, the founder can aggressively increase ad budgets to capture additional market share.
Break-Even ROAS Matrix by Gross Margin
Reference this quick-conversion matrix to know your exact required break-even hurdle before launching ad campaigns:
| Product Gross Margin | Break-Even ROAS Multiplier | Break-Even ROAS % | Max Allowable Ad Spend % |
|---|---|---|---|
| 80% (Digital Products / SaaS) | 1.25x ROAS | 125% | 80.0% of Revenue |
| 65% (Premium DTC / Beauty) | 1.54x ROAS | 154% | 65.0% of Revenue |
| 50% (Standard E-Commerce) | 2.00x ROAS | 200% | 50.0% of Revenue |
| 40% (Consumer Electronics) | 2.50x ROAS | 250% | 40.0% of Revenue |
| 25% (Wholesale / Reselling) | 4.00x ROAS | 400% | 25.0% of Revenue |
Where to Find Your Numbers
To produce institutional-grade paid media models that protect cash reserves and avoid liquidity crises, gather verified commercial data:
- For Product Margins & Unit Economics: Calculate accurate gross profit margins and markups using our Pricing Strategy Calculator before configuring ad budgets.
- For Operating Breakeven Volume: Determine total units needed to cover fixed agency retainers and software with our Break-Even Calculator.
- For Sales Funnel Velocity: Model how conversion rates impact overall top-line collections with our Revenue Forecast Calculator.
- For Working Capital & Ad Financing: Ensure rapid ad scaling does not drain your operating cash balance using our Burn Rate Calculator.
- For Downside Ad Performance Stress Testing: Model campaign efficiency dips during seasonal slumps with our Business Scenario Calculator.
What This Calculator Can and Cannot Tell You
What it tells you:
- Exact gross revenue return per dollar of paid advertising expenditure.
- The precise minimum break-even ROAS required to prevent operating cash losses.
- Actual dollar net profit after accounting for both media spend and product fulfillment costs.
What it cannot tell you:
- Multi-Touch Attribution Reality: Ad platforms (Google, Meta, TikTok) often over-report sales due to overlapping 7-day click or 1-day view attribution windows. Cross-verify with Google Analytics 4 (GA4) or third-party server tracking.
- Customer Lifetime Value (LTV): In subscription or repeat-order brands, acquiring a customer at break-even or slight initial loss can be highly profitable if they reorder 3 to 5 times over their lifecycle.
- Blended Marketing Efficiency Ratio (MER): ROAS evaluates siloed paid ad channels; it does not measure overall business Marketing Efficiency Ratio (Total Revenue ÷ Total Marketing Spend across organic and paid channels).
Related Guides and Calculators
Master commercial acquisition, pricing economics, and financial governance with our founder suite:
Frequently Asked Questions
The Bottom Line
Scaling paid advertising without tracking break-even ROAS is the fastest way to deplete operational cash reserves. Always calculate your margin hurdles, price your products sustainably with our Pricing Strategy Calculator, test your unit thresholds with our Break-Even Calculator, and manage your liquidity with our Burn Rate Calculator.
- Google Marketing Platform: Measuring Ad Effectiveness and Target ROAS Optimization
- Meta Business Help Center: Understanding Return on Ad Spend (ROAS) and Attribution Windows
- Harvard Business Review: A Refresher on Marketing ROI and Attribution Models
- Corporate Finance Institute (CFI): ROAS vs. ROI: Key Differences in Financial Marketing Analysis
Disclaimer: This calculator is provided for strategic planning and educational modeling purposes only. It does not constitute formal financial advisory or guaranteed advertising performance. Actual ad performance depends on platform bidding algorithms, conversion tracking accuracy, and market demand.