
Business KPI Calculator: Free Margin & Break-Even Tool
The Business KPI Calculator shows how healthy a business is using a few key numbers. Enter revenue, cost of goods sold, and operating expenses to see gross, operating, and net margin, the revenue needed to break even, and where each dollar of sales goes. Results update as you type.
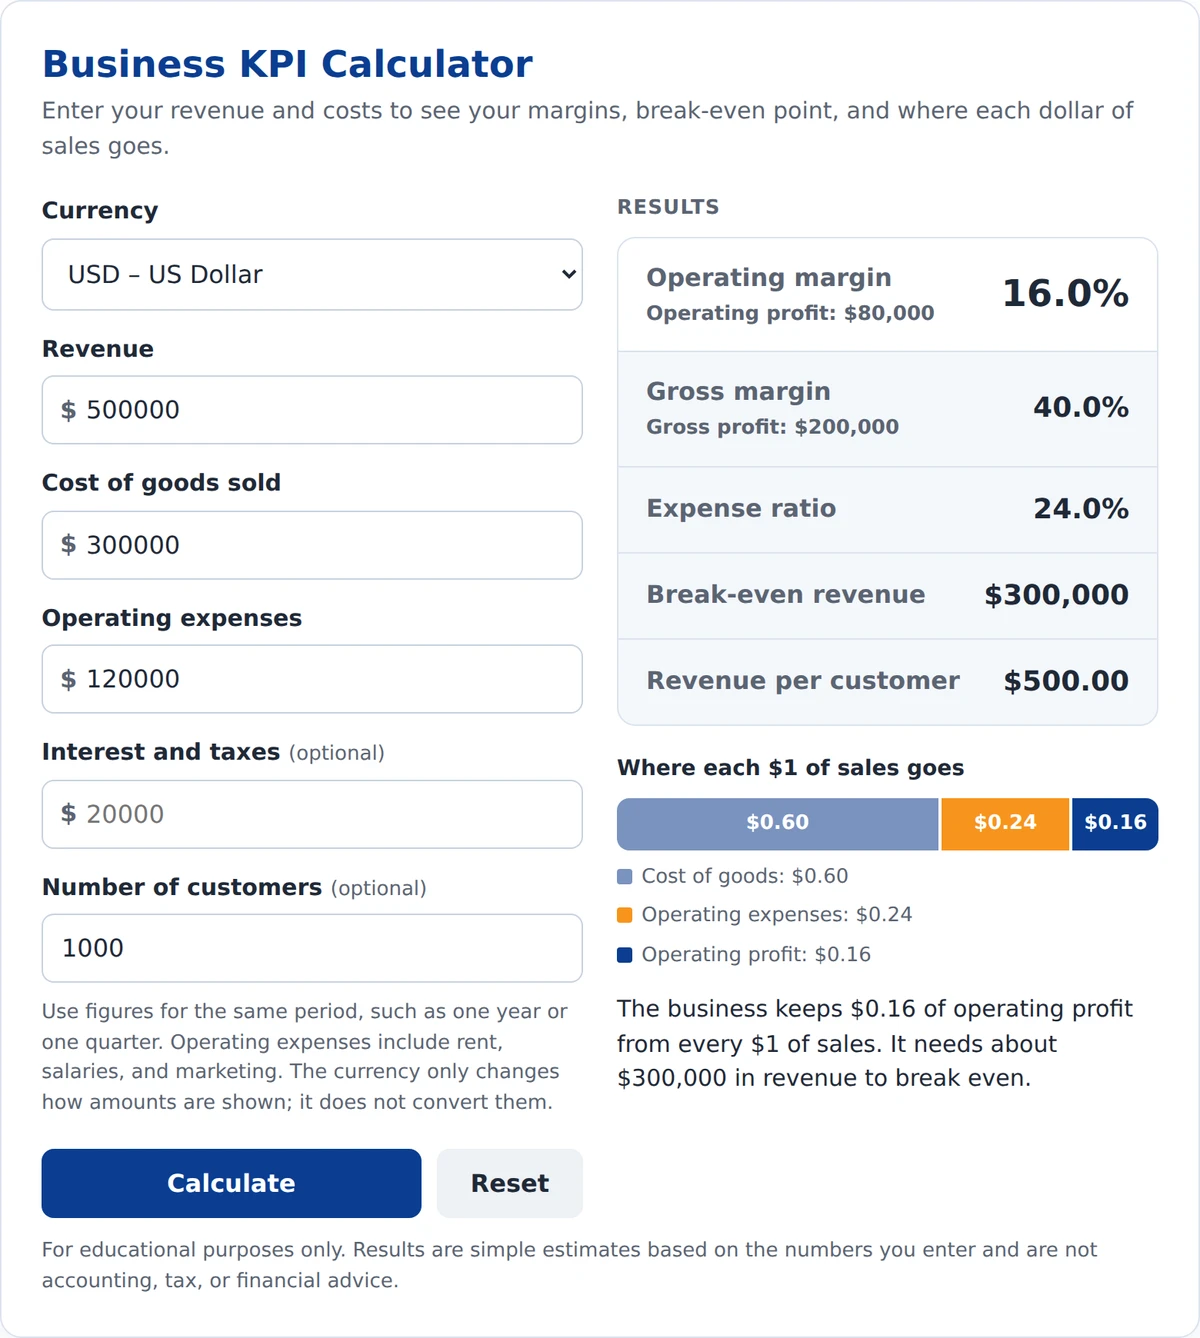
Enter your revenue and costs to see your margins, break-even point, and where each dollar of sales goes.
Use figures for the same period, such as one year or one quarter. Operating expenses include rent, salaries, and marketing. The currency only changes how amounts are shown; it does not convert them.
Results
For educational purposes only. Results are simple estimates based on the numbers you enter and are not accounting, tax, or financial advice.
How to Use the Business KPI Calculator
- Currency: Pick the currency your numbers are in. It only changes how amounts are shown; it does not convert them.
- Revenue: Enter total sales for the period.
- Cost of goods sold: Enter the direct cost of the products or services you sold.
- Operating expenses: Enter costs such as rent, salaries, and marketing.
- Interest and taxes (optional): Add these to see net margin.
- Number of customers (optional): Add this to see revenue per customer.
Use numbers from the same period, such as one year or one quarter. Results update as you type.
How Are Business KPIs Calculated?
Gross margin = (Revenue − Cost of goods sold) ÷ Revenue × 100
Operating margin = (Gross profit − Operating expenses) ÷ Revenue × 100
Net margin = (Operating profit − Interest and taxes) ÷ Revenue × 100
Expense ratio = Operating expenses ÷ Revenue × 100
Break-even revenue = Operating expenses ÷ Gross margin
Revenue per customer = Revenue ÷ Number of customers
Example: A business has $500,000 in revenue, $300,000 in cost of goods sold, and $120,000 in operating expenses.
- Gross profit is $200,000, so the gross margin is 40%.
- Operating profit is $80,000, so the operating margin is 16%.
- With $20,000 in interest and taxes, net profit is $60,000, a net margin of 12%.
- Break-even revenue is $120,000 ÷ 40% = $300,000.
- With 1,000 customers, revenue per customer is $500.
What Do Business KPIs Tell You?
| KPI | What it shows | What to watch |
|---|---|---|
| Gross margin | How much is left from each sale after the direct cost of the product | A falling gross margin can mean rising supplier costs or price cuts |
| Operating margin | How much profit the core business makes before interest and taxes | Best for comparing how well companies control day-to-day costs |
| Net margin | How much of each sale ends up as final profit | One-time gains or charges can make it jump or drop |
| Expense ratio | How much of revenue goes to running the business | If it rises faster than sales, costs are growing too quickly |
| Break-even revenue | The sales needed to cover all operating expenses | The closer revenue is to this number, the less room for a bad month |
| Revenue per customer | The average amount each customer spends | Useful for pricing and marketing decisions |
Margins vary widely by industry. A grocery chain can do well with a thin margin, while a software company usually needs a much higher one. Compare a business with its own past results and with similar companies.
Real Example: Costco in Fiscal 2026
Costco reported revenue of $303.2 billion for its fiscal year ended August 30, 2026. Merchandise costs were $264.3 billion and selling, general, and administrative expenses were $27.2 billion, leaving operating income of $11.7 billion and net income of $9.2 billion (Costco).
- Gross margin: about 12.8%
- Operating margin: about 3.9%
- Net margin: about 3.0%
- Expense ratio: about 9.0%
Those margins look thin, but they are part of Costco's model: it keeps prices low and earns much of its profit from membership fees. Membership fees of about $5.9 billion were equal to roughly half of its operating income.
Where Can You Find These Numbers?
- Your own business: Use the income statement (profit and loss report) from your accounting software.
- Public companies: Look at the latest earnings release on the company's investor relations website, or its annual report (Form 10-K) on SEC EDGAR.
New to these documents? Start with our guide on how to read an earnings report.
What the Business KPI Calculator Can and Cannot Tell You
It can show how profitable a business is, how much it spends to run, and how much it needs to sell to break even.
It cannot:
- Show how fast a business is growing. Use our revenue growth calculator or business growth calculator for that.
- Measure cash flow. A profitable business can still run short of cash.
- Separate one-time items, such as a lawsuit payment or asset sale, from regular results.
- Tell you whether a stock is a good buy.
Frequently Asked Questions
What is a business KPI calculator?
A business KPI calculator turns a company's revenue and costs into key performance indicators such as gross margin, operating margin, net margin, and break-even revenue. It shows at a glance how profitable a business is and where its money goes.
What is a good profit margin?
It depends on the industry. Retailers and grocery chains often run on low single-digit net margins, while software companies can earn much more. The best benchmark is the company's own history and similar businesses.
What is the difference between gross margin and operating margin?
Gross margin only subtracts the direct cost of the products sold. Operating margin also subtracts running costs such as rent, salaries, and marketing, so it is usually lower.
How is break-even revenue calculated?
Divide operating expenses by gross margin. If operating expenses are $120,000 and the gross margin is 40%, the business needs $300,000 in revenue to break even.
Can margins be negative?
Yes. If costs are higher than revenue, the margin is negative and the business is losing money. The calculator shows losses in orange.
Final Takeaway
Revenue alone doesn't show how healthy a business is. Use the calculator above to check margins and the break-even point, then compare the results with past periods and similar companies before drawing conclusions.