CAC Calculator: Customer Acquisition Cost & Payback Period
This free CAC calculator calculates your Customer Acquisition Cost (CAC) across both paid advertising and fully loaded blended marketing channels. In addition to direct media spend, it accounts for marketing and sales payroll, creative agency retainers, and software subscriptions to calculate your true cost to win a paying customer and your CAC payback period in months.
Who it's for: B2B SaaS founders, direct-to-consumer e-commerce operators, growth marketers, venture investors, and CFOs auditing unit economics and marketing payback periods.
Why use it:
- Uncover True Fully Loaded CAC: Avoid relying solely on ad platform metrics by factoring in sales commissions, marketing payroll, and software tooling costs.
- Calculate CAC Payback Period: Determine exactly how many months of customer revenue and gross margin are required to fully recover your acquisition investment.
- Benchmark Against Institutional Standards: Ensure your acquisition efficiency aligns with venture capital benchmarks (payback under 12 months, LTV:CAC of 3:1+).
How to Use the CAC Calculator
- Select Acquisition Methodology:
- Choose Fully Loaded Blended CAC to incorporate all sales and marketing costs (ad spend, staff salaries, commissions, software stack, and agency retainers) divided across all acquired customers.
- Choose Paid Ad CAC & Payback to isolate direct digital advertising efficiency across Meta, Google, TikTok, and Amazon Ads.
- Enter Paid Media Expenditures: Input direct media spend across all advertising channels for your designated reporting period.
- Allocate Sales & Marketing Payroll: Enter the combined gross payroll, bonuses, and commissions of dedicated marketing, sales, and SDR team members (model this with our Cost per Employee Calculator).
- Input Software & Agency Overhead: Include marketing automation software (HubSpot, Salesforce, Klaviyo), tracking tools, and outside agency retainer fees.
- Enter New Customer Count & ARPU: Input total new paying customers acquired alongside their Average Revenue per User (ARPU) and product gross profit margin percentage.
- Review Acquisition Efficiency & Payback: Analyze your blended CAC, direct paid CAC, monthly gross margin per user, and exact CAC payback period in months.
How It Works: Blended CAC vs. Paid CAC Formulas
Accurate unit economics requires separating direct advertising acquisition costs from fully loaded operational acquisition costs:
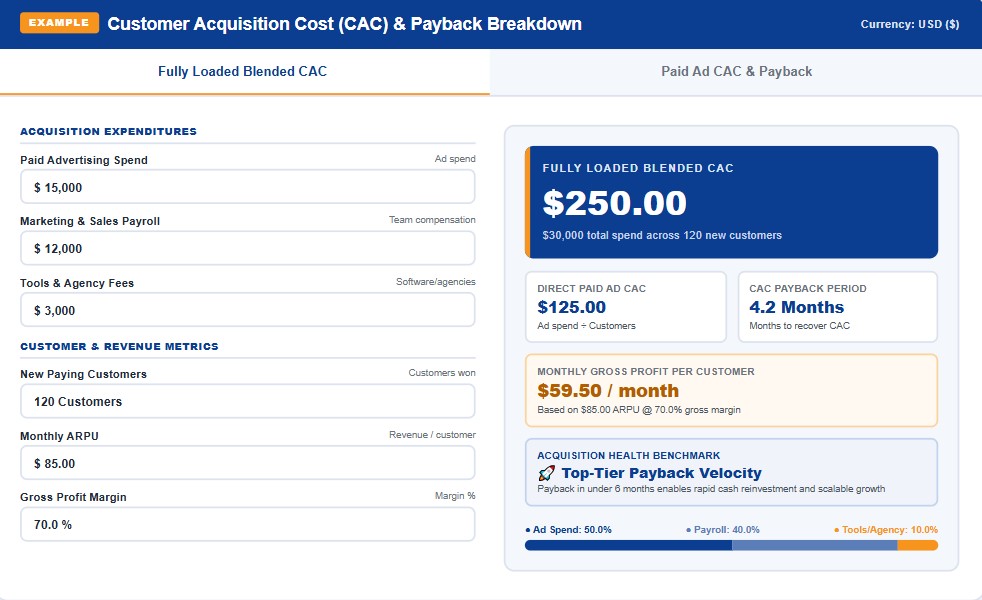
The Paid CAC Illusion: A startup might celebrate a $125 Paid CAC based purely on Meta Ads reports. However, once two sales reps, a copywriter, CRM subscriptions, and agency retainers are included, the true Fully Loaded CAC jumps to $250. Failing to calculate loaded CAC leads directly to premature cash exhaustion.
Worked Example: B2B SaaS Growth Acquisition Economics
A B2B software company invests heavily in digital acquisition over a 30-day operating cycle:
- Paid Ad Spend: $15,000 on LinkedIn and Google Search Ads.
- Sales & Marketing Payroll: $12,000 (SDR salary and sales commissions).
- Software & Tools: $3,000 (HubSpot, ZoomInfo, attribution software).
- Total Acquisition Expenditure: $15,000 + $12,000 + $3,000 = $30,000 all-in spend.
- New Paying Customers Acquired: 120 customer accounts.
- Average Monthly Revenue (ARPU): $85.00/month with a 70.0% gross profit margin.
The Strategic Output:
- Direct Paid CAC: $15,000 ÷ 120 = $125.00 per customer.
- Fully Loaded Blended CAC: $30,000 ÷ 120 = $250.00 per customer.
- Monthly Gross Profit per User: $85.00 × 70.0% = $59.50 gross cash/month.
- CAC Payback Period: $250.00 ÷ $59.50 = 4.20 Months Payback.
Executive Insight: Because the company fully recovers its customer acquisition cost in just 4.2 months (well within the top-tier 12-month venture benchmark), the founders can confidently increase marketing budgets to accelerate compounding annual recurring revenue (ARR).
CAC Payback Period Benchmarks by Industry
Venture investors and financial lenders evaluate acquisition efficiency against established sector payback timelines:
| Industry Sector | Top-Tier Payback | Median Payback | Primary Unit Economics Risk |
|---|---|---|---|
| B2B Enterprise SaaS | < 9 Months | 12 – 18 Months | Long sales cycles & delayed cash collections. |
| SMB SaaS & Cloud Apps | < 6 Months | 8 – 12 Months | Higher customer churn rates & credit card failures. |
| DTC E-Commerce & Retail | First Order (0 Mos) | 1 – 3 Months | Thin gross margins & rising Meta/TikTok CPMs. |
| Financial Services & Fintech | < 12 Months | 15 – 24 Months | High regulatory compliance & account onboarding costs. |
Where to Find Your Numbers
To produce institutional-grade unit economic models for board updates, debt financing, or pitch decks, source verified corporate metrics:
- For Direct Ad Efficiency & Multipliers: Evaluate channel ROAS and break-even thresholds using our ROAS Calculator.
- For Marketing & Sales Staff Costs: Calculate the fully loaded wages, taxes, and benefits of your sales team with our Cost per Employee Calculator.
- For Product Margin Architecture: Ensure gross margin percentages accurately reflect COGS and fulfillment with our Pricing Strategy Calculator.
- For Operational Cash Runway: Model how your CAC payback timeline drains cash reserves using our Burn Rate Calculator.
- For Revenue Funnel Projections: Forecast future customer volume based on lead closing rates with our Revenue Forecast Calculator.
What This Calculator Can and Cannot Tell You
What it tells you:
- Exact dollar cost to acquire a paying customer under direct paid and fully loaded blended models.
- The precise number of months required to recover acquisition spend based on gross margins.
- The percentage distribution of acquisition dollars across media spend, team payroll, and tools.
What it cannot tell you:
- Customer Churn Dynamics: If an average customer churns after 3 months, but your CAC payback period is 6 months, your business permanently loses cash on every acquired account.
- Organic Referral Spillover: Heavy paid advertising often fuels unmeasured word-of-mouth and organic search visits that lower overall blended CAC.
- Cohort Lag Timing: In enterprise sales with 90-day cycles, ad spend spent in January generates customer wins in April. Measuring CAC in single-month silos can temporarily distort monthly metrics.
Related Guides and Calculators
Master commercial acquisition, pricing economics, and financial governance with our founder suite:
Frequently Asked Questions
The Bottom Line
Controlling customer acquisition cost and shortening your payback period is the foundation of capital-efficient scaling. Pair your acquisition models with our ROAS Calculator, verify fully loaded labor costs with our Cost per Employee Calculator, and preserve operational runway using our Burn Rate Calculator.
- Harvard Business Review: The Value of Keeping the Right Customers and CAC Dynamics
- OpenView Venture Partners: SaaS Metrics Guide: Benchmarking CAC Payback & Net Retention
- Corporate Finance Institute (CFI): Customer Acquisition Cost (CAC) Formula & Analysis
- Bessemer Venture Partners: Scaling to $100M: Unit Economics and Acquisition Efficiency
Disclaimer: This calculator is provided for strategic planning and educational modeling purposes only. It does not constitute formal financial appraisal, venture fundraising guarantees, or certified auditing. Actual customer acquisition metrics depend on attribution models and seasonal sales cycles.