Revenue Forecast Calculator: Project Sales Pipeline & Growth Trajectory
This free revenue forecast calculator estimates future business revenues using weighted sales pipeline conversion metrics and baseline growth rates. It enables commercial founders, sales leaders, and financial planners to forecast monthly, quarterly, and annual top-line revenue based on lead velocity, win rates, average contract value (ACV), and customer churn.
Who it's for: B2B founders, sales directors, corporate finance executives, and commercial business planners seeking realistic revenue projections for budgeting, staffing, and investor reporting.
Why use it:
- Eliminate Revenue Guesswork: Ground financial expectations in conversion pipeline math rather than wishful top-line revenue assumptions.
- Adjust for Customer Churn & Attrition: Account for revenue attrition so your annual pro forma projections reflect true net retained revenue.
- Align Hiring with Sales Capacity: Discover exactly how many qualified leads and closed deals are required to meet corporate growth milestones.
How to Use the Revenue Forecast Calculator
- Select Forecasting Methodology:
- Choose Sales Pipeline Model (Funnel) for bottom-up commercial sales, agency pipelines, and contract-driven businesses with measurable conversion stages.
- Choose Growth Velocity Model (Historical) for top-down compounding projections based on trailing annual revenue, target expansion percentages, and churn.
- Input Pipeline Volume & Deal Size: For pipeline forecasting, enter your monthly Marketing Qualified Leads (MQLs), your closed-won conversion rate (typically 10%–20%), and your Average Contract Value (ACV).
- Set Baseline Revenue & Churn: If using historical growth velocity, input your trailing twelve months (TTM) revenue alongside expected annual expansion and gross revenue churn.
- Choose Your Forecast Horizon: Select between a 12-month (1-year), 24-month (2-year), or 36-month (3-year) projection horizon to visualize cumulative top-line performance.
- Evaluate Strategic Outputs: Inspect annual projected run-rate, quarterly sales milestones, monthly deal velocity, and net retained revenue.
How It Works & Revenue Projection Formulas
Accurate revenue modeling balances bottom-up pipeline generation with top-down retention mathematics:
Bottom-up pipeline forecasting provides tactical operational targets for your sales team. Top-down velocity forecasting accounts for compound growth while factoring in customer cancellations, ensuring your hiring budget does not outpace cash collections.
Worked Example: B2B Enterprise SaaS Sales Funnel
A B2B enterprise SaaS business operates with a dedicated outbound sales team targeting mid-market corporations:
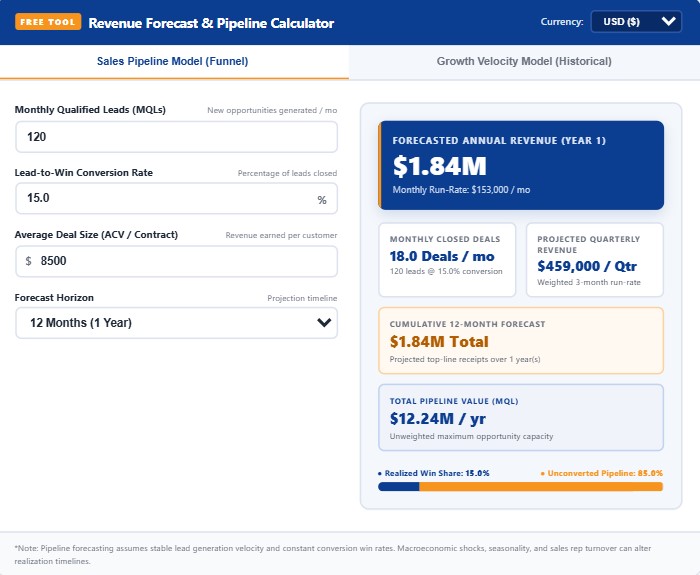
- Monthly Qualified Leads (MQLs): 120 vetted enterprise prospects.
- Lead-to-Win Conversion Rate: 15.0% historical closing rate.
- Average Contract Value (ACV): $8,500 annual software license fee.
The Strategic Output:
- Monthly Closed Deals: 120 leads × 15.0% = 18.0 closed contracts per month.
- Monthly Projected Revenue: 18 deals × $8,500 = $153,000 per month.
- Projected Annual Run-Rate: $153,000 × 12 = $1,836,000 per year.
- Quarterly Run-Rate Target: $1,836,000 ÷ 4 = $459,000 per quarter.
Industry Sales Conversion Benchmarks
Benchmark your commercial closing rates and customer churn against verified institutional averages across major commercial sectors:
| Industry Sector | Lead-to-Win Rate | Typical Sales Cycle | Annual Revenue Churn |
|---|---|---|---|
| B2B Enterprise SaaS | 12% – 18% | 60 – 120 Days | 5% – 8% |
| Professional Services & Consulting | 20% – 30% | 30 – 60 Days | 10% – 15% |
| E-Commerce & Direct-to-Consumer | 2.0% – 3.5% | Instant / 1 – 7 Days | N/A (Repeat Rate 25%–35%) |
| Commercial Wholesale & Manufacturing | 15% – 25% | 90 – 180 Days | 4% – 7% |
Where to Find Your Numbers
To construct defensible financial projections for banking institutions, angel investors, or internal budget allocations, source verified data:
- For Unit Pricing & Contract Value: Structure product pricing and gross margins with our Pricing Strategy Calculator before locking in your deal size.
- For Market Penetration & Headroom: Ensure your projected revenue fits within your industry's total addressable market using our Market Share Calculator.
- For Break-Even Milestones: Calculate the exact sales volume needed to cover fixed overhead using our Break-Even Calculator.
- For Cash Runway Planning: Compare forecast collections against monthly operational expenditures with our Burn Rate Calculator.
- For Formal Business Plans: Embed multi-year revenue projections into institutional financing decks using our framework on How to Write a Business Plan[cite: 2].
What This Calculator Can and Cannot Tell You
What it tells you:
- Exact monthly, quarterly, and annual top-line revenue generated by your existing sales funnel.
- Net compound growth velocity adjusted downward for annual contract cancellations and churn.
- The precise monthly deal count your team must close to achieve target corporate budgets.
What it cannot tell you:
- Cash Collection Timing (Working Capital): Invoiced revenue does not equal cash in the bank. Net-30, Net-60, or delayed payment terms can create liquidity shortfalls despite growing sales.
- Sales Rep Quota Ramp Times: It assumes steady closing capacity; it does not model the 3-to-6-month ramp-up time required for new sales account executives to reach full quota.
- Macroeconomic Contraction: Sudden interest rate changes, category recessions, or competitor price wars can depress historical conversion rates without warning.
Related Guides and Calculators
Master commercial planning, pricing architecture, and cash flow governance with our founder suite:
Frequently Asked Questions
The Bottom Line
A realistic revenue forecast transforms corporate growth targets into daily, actionable sales milestones. Combine your top-line pipeline models with strict margin discipline using our Pricing Strategy Calculator and protect your operational liquidity with our Burn Rate Calculator.
- Harvard Business Review: The Right Way to Build a Sales Forecast by Mark Roberge
- Corporate Finance Institute (CFI): Top-Down vs. Bottom-Up Financial Forecasting Methods
- Financial Management Association (FMA): Revenue Recognition & Deferred Billing Standards
- U.S. Small Business Administration (SBA): Sales Forecasting and Budgeting Guidelines for Growth
Disclaimer: This calculator is provided for strategic planning and educational modeling purposes only. It does not constitute formal financial appraisal, securities prospectus data, or guaranteed earnings projections. Validate all forecasts against certified management accounts.