Employee Turnover Calculator: Measure Turnover Rate & Replacement Costs
This free employee turnover calculator calculates your annual staff turnover rate, employee retention percentage, and the total financial cost of employee attrition. It helps human resource leaders, startup founders, and operational executives quantify the true organizational impact of lost staff—including recruitment fees, onboarding costs, and lost productivity.
Who it's for: HR directors, department heads, corporate recruiters, small business owners, and finance teams planning annual talent acquisition budgets and retention initiatives.
Why use it:
- Uncover True Attrition Costs: Quantify the hidden expense of replacing departed staff, which typically averages 30% to 150% of an employee's annual salary.
- Benchmark Against Industry Averages: Compare your organization's turnover and retention rates against standard labor market metrics to diagnose culture or compensation issues.
- Justify Retention Investments: Build data-driven business cases for competitive compensation packages, wellness programs, and management training to reduce voluntary exits.
How to Use the Employee Turnover Calculator
- Select Timeframe Mode: Choose between Annual Turnover Analysis (standard fiscal reporting) or Monthly / Rolling Period for quarterly or monthly HR audits.
- Input Headcount Figures: Enter your total employee headcount at the start and end of the measurement timeframe.
- Input Total Separations: Enter the number of employee exits (both voluntary resignations and involuntary terminations) that occurred during that period.
- Set Average Role Compensation: Enter the average annual base salary for the departed positions.
- Select Replacement Cost Multiplier: Choose a cost tier based on role complexity:
- 30%: Entry-level, hourly, hospitality, or retail staff.
- 50%: Mid-level corporate, operations, and specialized employees (standard benchmark).
- 100%: Experienced managers, senior software engineers, and specialized technical talent.
- 150%: Senior executives, directors, and C-suite leadership.
- Analyze Attrition Metrics: Review your turnover rate percentage, retention rate, cost per exit, and total annual financial drain.
How It Works & Fundamental Turnover Formulas
Employee turnover measures the rate at which an employer gains and loses staff according to standard Department of Labor formulas:
The true cost of losing an employee extends far beyond basic severance pay. It incorporates job posting advertising fees, recruiter commissions, executive interviewing hours, background checks, training curves, and unrecovered productivity losses while the seat remains vacant.
Worked Example: 100-Person Organization Turnover Impact
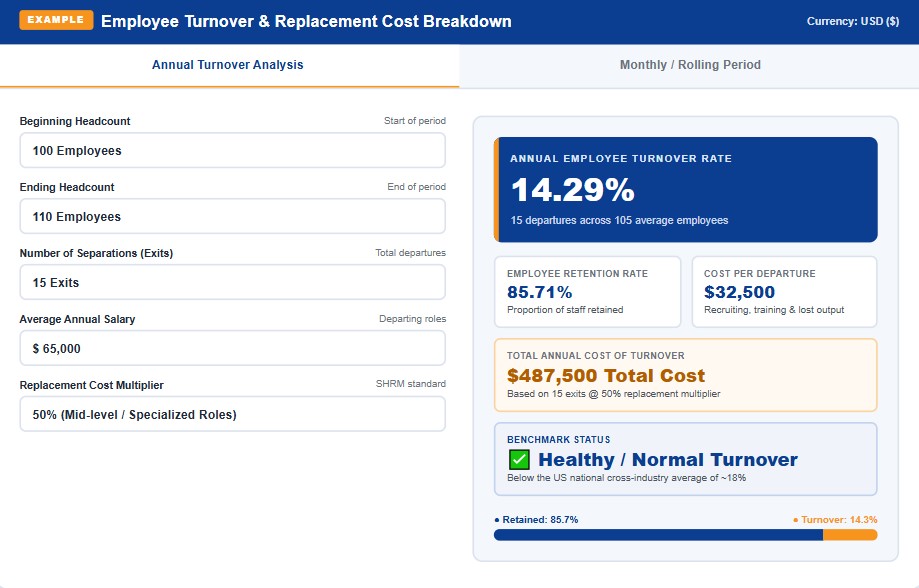
A mid-sized corporate company begins the year with 100 employees, finishes with 110 employees, and experiences 15 staff exits throughout the year:
- Average Headcount: (100 + 110) ÷ 2 = 105 employees.
- Annual Turnover Rate: (15 ÷ 105) × 100 = 14.29% Turnover Rate.
- Annual Retention Rate: 100% − 14.29% = 85.71% Retention Rate.
- Average Base Salary: $65,000 for departing mid-level roles.
- Replacement Cost Multiplier: 50% (Standard mid-level replacement cost).
- Cost per Individual Exit: $65,000 × 0.50 = $32,500 per lost worker.
- Total Financial Turnover Cost: 15 exits × $32,500 = $487,500 in total attrition drain.
Executive Insight: Even with a healthy 14.3% turnover rate, replacing 15 workers costs nearly half a million dollars in unbudgeted overhead. Reducing turnover by just 5 employees saves the company over $160,000 annually.
Industry Turnover Rate Benchmarks
Compare your organization's annual turnover against historical industry benchmarks published by the U.S. Bureau of Labor Statistics (BLS):
| Industry Sector | Average Annual Turnover | Typical Replacement Cost | Primary Attrition Driver |
|---|---|---|---|
| Hospitality, Food & Retail | 45% – 75% | 25% – 35% of Salary | Wage competition & irregular scheduling. |
| Healthcare & Nursing | 20% – 30% | 75% – 100% of Salary | Burnout, overtime stress & patient ratios. |
| Tech & Software Engineering | 12% – 18% | 100% – 150% of Salary | Aggressive poaching & equity compensation. |
| Finance, Banking & Insurance | 10% – 15% | 60% – 100% of Salary | Career advancement & bonus structures. |
| Manufacturing & Logistics | 25% – 35% | 30% – 50% of Salary | Physical strain & entry-level wage adjustments. |
Where to Find Your Numbers
To produce institutional-grade human capital models for board compensation committees or budgeting audits, gather verified corporate data:
- For Operating Cash Flow Impact: Model how turnover replacement expenses impact your runway using our Burn Rate Calculator.
- For Operational Downside Sensitivity: Stress-test your labor budget against revenue contraction scenarios with our Business Scenario Calculator.
- For Unit Margin Preservation: Ensure your product pricing accounts for fully loaded staff costs using our Pricing Strategy Calculator.
- For Zero-Loss Volume Thresholds: Determine how higher turnover expenses affect your sales break-even targets with our Break-Even Calculator.
- For Long-Term Strategic Planning: Structure compensation plans and organizational charts using our guide on How to Write a Business Plan.
What This Calculator Can and Cannot Tell You
What it tells you:
- Standard turnover and retention percentages based on verified headcount figures.
- The estimated financial cash drain of replacing departed employees.
- How your organization compares against national cross-industry averages.
What it cannot tell you:
- Voluntary vs. Involuntary Exit Nuance: The formula treats all exits equally; however, losing an underperforming employee who was terminated differs strategically from losing a top-performing executive voluntarily.
- Intangible Team Morale Impact: High turnover damages institutional memory, exhausts remaining staff who must absorb vacant workloads, and dampens team morale—costs that cannot be fully captured on a balance sheet.
- Time-to-Fill Variations: Filling an entry-level clerk position may take 14 days, whereas finding a specialized machine learning engineer can take 120+ days, leading to compounding productivity losses.
Related Guides and Calculators
Explore our strategic business toolkit to optimize human capital, operating costs, and organizational performance:
Frequently Asked Questions
The Bottom Line
Employee turnover is one of the largest unbudgeted expenses on a company's income statement. Regularly auditing your turnover rate, stress-testing operations with our Business Scenario Calculator, and monitoring overhead with our Burn Rate Calculator enables executive teams to protect profitability and preserve top talent.
- U.S. Bureau of Labor Statistics (BLS): Job Openings and Labor Turnover Survey (JOLTS)
- Society for Human Resource Management (SHRM): Human Capital Benchmarking & Cost-of-Hire Report
- Harvard Business Review: Why People Really Leave Their Jobs and How to Retain Them
- Gallup Workplace Research: The True Cost of Employee Disengagement & Turnover
Disclaimer: This calculator is provided for strategic planning and educational modeling purposes only. It does not constitute formal human resources compliance, legal labor advisory, or certified financial auditing. Tailor retention and separation policies with qualified legal and HR counsel.