Business Scenario Calculator: Stress-Test Profitability & Risk
This free business scenario calculator allows business owners, corporate executives, and financial planners to conduct sensitivity analysis across three distinct operating environments: Base Case, Best Case, and Worst Case. By modeling fluctuating revenue levels, variable cost inflation, and fixed overhead changes, this tool projects operating income and net margin durability instantly.
Who it's for: Founders, chief financial officers (CFOs), operations managers, and commercial lenders looking to stress-test financial durability before taking on debt or expanding capital expenditures.
Why use it:
- Uncover Operational Downside Risk: Identify exactly how steep a revenue contraction your business can survive before turning operating-cash-flow negative.
- Stress-Test Cost Inflation: Measure how rising supplier prices and wage pressure impact bottom-line profit margins under unchanged sales volume.
- Make Confident Capital Allocations: Present defensible, multi-scenario sensitivity tables to commercial loan underwriters and board members.
How to Use the Business Scenario Calculator
- Enter Base Case Operations: Input your expected annual baseline revenue, variable cost percentage (COGS and direct fulfillment), and fixed annual overhead (rent, baseline payroll, software).
- Set Upside Expansion Parameters: Define your Best-Case revenue surge percentage (e.g., +25% revenue expansion resulting from new product adoption or viral distribution).
- Define Downside Stress Parameters: Specify your Worst-Case revenue contraction percentage (e.g., -20% due to broader macroeconomic recession or lost enterprise accounts).
- Factor in Variable Cost Inflation: Enter anticipated cost-of-goods price spikes (e.g., a 5% increase in variable raw material costs) to simulate supply chain compression.
- Analyze Comparative Resilience: Review side-by-side operating profit figures, net margin percentages, profit swings, and the maximum revenue drop buffer before reaching operating losses.
How It Works & Sensitivity Analysis Formulas
Scenario modeling isolates the impact of external revenue and cost shocks on operating income (EBIT):
Because fixed costs remain constant regardless of sales volume, changes in top-line revenue produce operating leverage—causing operating profits to expand much faster on the upside, but collapse rapidly when revenue contracts.
Worked Example: $1M Commercial Business Stress Test
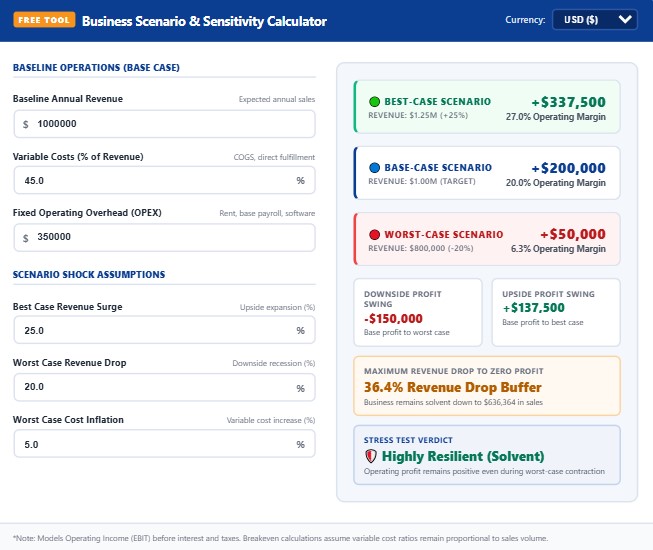
A manufacturing and distribution company operates with $1,000,000 baseline sales, 45% variable COGS, and $350,000 in fixed overhead:
- Base Case (Target Performance):
Revenue: $1,000,000 | COGS: $450,000 | Fixed: $350,000.
Operating Profit: $1,000,000 − $450,000 − $350,000 = +$200,000 (20.0% Margin). - Best Case (+25% Revenue Expansion):
Revenue: $1,250,000 | COGS (45%): $562,500 | Fixed: $350,000.
Operating Profit: $1,250,000 − $562,500 − $350,000 = +$337,500 (27.0% Margin).
A 25% revenue increase drives a massive 68.8% surge in operating profit. - Worst Case (-20% Revenue Drop + 5% Cost Inflation):
Revenue: $800,000 | COGS (50%): $400,000 | Fixed: $350,000.
Operating Profit: $800,000 − $400,000 − $350,000 = +$50,000 (6.3% Margin).
Profits plummet by $150,000, but the enterprise remains solvent and cash-flow positive. - Revenue Safety Buffer: Breakeven revenue equals $350,000 ÷ 0.55 = $636,364. The business can withstand a 36.4% total drop in sales before posting operating losses.
Strategic Planning: The 3 Operational Scenarios
| Operating Scenario | Typical Triggers | Executive Focus | Capital Allocation Rule |
|---|---|---|---|
| Best Case (Upside) | Competitor exit, viral demand, rapid sales adoption. | Supply chain capacity & fulfillment speed. | Reinvest profits into working capital & customer acquisition. |
| Base Case (Plan) | Target marketing execution, historical renewal rates. | Margin discipline & operational efficiency. | Fund budgeted operational milestones and hiring plans. |
| Worst Case (Stress) | Macroeconomic recession, supplier inflation, client churn. | Cash conservation & overhead reduction. | Freeze hiring, eliminate discretionary spending, preserve runway. |
Where to Find Your Numbers
To populate your scenario model with reliable operational inputs, gather verified internal data:
- For Baseline Sales Pipeline Forecasts: Project expected base-case revenue using our Revenue Forecast Calculator.
- For Unit Costs & COGS Ratios: Establish your variable cost margins with our Pricing Strategy Calculator.
- For Zero-Loss Volume Benchmarks: Pinpoint your exact sales threshold using our Break-Even Calculator.
- For Cash Burn Stress Testing: Verify how long your cash balance survives if a worst-case scenario hits using our Burn Rate Calculator.
- For Long-Term Growth Benchmarking: Compare multi-year expansion trajectories against historical trends with our Growth Rate Calculator.
What This Calculator Can and Cannot Tell You
What it tells you:
- Exact dollar profit and percentage margin across best, base, and worst operating environments.
- The financial downside swing your business must absorb during an economic downturn.
- The maximum percentage drop in revenue your company can survive before becoming insolvent.
What it cannot tell you:
- Cash Collection Timing: Operating profit does not guarantee cash availability. If accounts receivable collections slow down during a recession, a business can face insolvency despite theoretical accounting profits.
- Semi-Variable Overhead Steps: In extreme growth or contraction, fixed costs rarely stay flat. Dramatic growth requires new facility leases (step costs), while dramatic drops trigger restructuring severance costs.
- Competitor Reactions: If industry demand drops by 20%, competitors often trigger price wars that further depress unit selling prices beyond basic cost inflation.
Related Guides and Calculators
Master corporate strategy, risk mitigation, and financial modeling with our founder suite:
Frequently Asked Questions
The Bottom Line
Stress-testing your financial structure before crises occur is the foundation of corporate risk management. Ground your base projections with our Revenue Forecast Calculator, establish your breakeven thresholds with our Break-Even Calculator, and monitor cash liquidity with our Burn Rate Calculator.
- Harvard Business Review: Scenario Planning: A Tool for Strategic Thinking by Paul J. H. Schoemaker
- Corporate Finance Institute (CFI): Scenario Analysis vs. Sensitivity Analysis Guide
- Financial Executives International (FEI): Stress Testing Corporate Cash Flows & Overhead Structures
- U.S. Small Business Administration (SBA): Managing Business Risk & Financial Preparedness
Disclaimer: This calculator is provided for strategic planning and educational modeling purposes only. It does not constitute formal insolvency underwriting, legal restructuring advice, or certified auditing. Validate all contingency models with a certified CPA.