Market Shares Calculator: Measure Industry Share & Competitive Standing
This free market share calculator calculates your business's exact market share percentage across your target market or broader industry. By comparing company sales against total market size or your primary competitor's revenue, this tool determines absolute market share, relative market share (RMS), and revenue market concentration instantly.
Who it's for: Business strategists, startup founders, marketing directors, equity research analysts, and executives preparing investor decks or evaluating competitive positioning.
Why use it:
- Measure Competitive Hegemony: Calculate relative market share (RMS) against the industry leader to evaluate pricing power and economies of scale.
- Validate Total Addressable Market (TAM): Benchmark your actual commercial penetration against your serviceable obtainable market (SOM).
- Track Market Expansion Over Time: Monitor whether revenue growth is outpacing organic industry expansion or simply following macro trends.
How to Use the Market Share Calculator
- Select Market Metric: Choose between Revenue / Value Share (standard dollar volume) or Volume / Unit Share (total physical units sold or subscriber counts).
- Enter Your Company Sales: Input your total annual gross or net sales for the target market segment.
- Input Total Market Size: Enter the aggregate market size for your defined category or geographic territory (Total Addressable Market or Serviceable Addressable Market).
- Input Top Competitor Sales (Optional): Enter the annual sales of the market leader in your niche to calculate Relative Market Share (RMS).
- Review Competitive Metrics: Inspect your absolute market share percentage, market share gap against the leader, and relative scale multiple.
How It Works & Fundamental Market Share Formulas
Market share quantifies what proportion of a total consumer or enterprise market is controlled by a specific commercial entity:
Absolute market share indicates your slice of the total pie. Relative Market Share (RMS), pioneered by the Boston Consulting Group (BCG Matrix), shows whether you enjoy structural cost advantages over competitors. An RMS greater than 1.0 indicates industry leadership.
Worked Example: Commercial Software Market Share Positioning
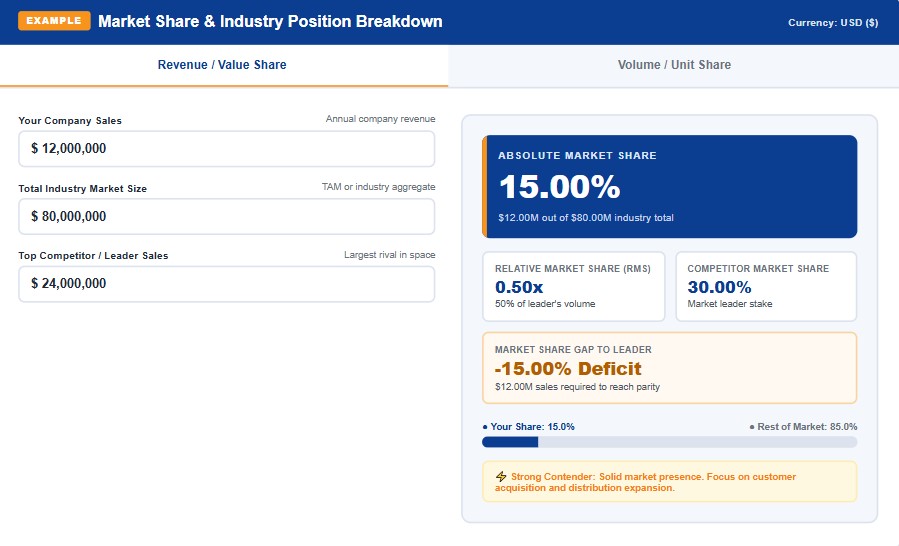
A B2B enterprise software provider competes in an industry valued at $80,000,000 annually:
- Company Sales: $12,000,000 in software subscriptions.
- Total Industry Size: $80,000,000 in annual category sales.
- Market Leader Sales: $24,000,000 (held by the dominant legacy provider).
Calculated Strategic Metrics:
- Absolute Market Share: ($12M ÷ $80M) × 100 = 15.00%.
- Market Leader Share: ($24M ÷ $80M) × 100 = 30.00%.
- Relative Market Share (RMS): $12M ÷ $24M = 0.50x (half the scale of the leader).
- Market Gap: 15.00% − 30.00% = -15.00% deficit ($12,000,000 in sales required to achieve parity).
BCG Matrix: Relative Market Share Classification
Relative Market Share (RMS) determines strategic resource allocation across product lines according to corporate strategy frameworks:
| Category Position | RMS Multiple | Market Growth Rate | Strategic Action |
|---|---|---|---|
| Cash Cows | > 1.0x (Leader) | Low / Mature | Harvest cash flow; reinvest in innovation. |
| Stars | > 1.0x (Leader) | High / Expanding | Aggressive capital investment to maintain dominance. |
| Question Marks | < 1.0x (Challenger) | High / Expanding | Decide whether to invest heavily to gain share or divest. |
| Dogs | < 1.0x (Niche/Lagging) | Low / Mature | Reposition into profitable sub-niches or exit. |
Where to Find Your Market Numbers
To produce institutional-grade market share calculations for board presentations or pitch decks, source reliable secondary research:
- For Unit Costs & Fixed Overheads: Confirm that your production volumes cover fixed costs by utilizing our Break-Even Calculator before spending capital to acquire market share.
- For Cash Runway & Burn: Aggressive market share grabs often require heavy upfront marketing spend. Track your cash runway using our Burn Rate Calculator.
- For Market Sizing & Strategy: Document your Total Addressable Market (TAM), competitive moat, and customer personas using our step-by-step guide on How to Write a Business Plan[cite: 2].
What This Calculator Can and Cannot Tell You
What it tells you:
- Exact percentage of total commercial or volume demand controlled by your business.
- Your Relative Market Share (RMS) index compared directly against your largest competitor.
- The financial sales gap required to overtake or tie with category leaders.
What it cannot tell you:
- Profitability & Unit Margins: High market share does not automatically equal high profit. Companies can buy market share through deep discounting while losing money on every unit sold.
- Brand Equity & Churn Risk: It measures historical sales volume; it does not indicate customer satisfaction, NPS scores, or contract renewal durability.
- Market Boundary Elasticity: If you define your industry too broadly (e.g., "all retail"), your market share will appear misleadingly tiny. If defined too narrowly, you risk missing disruptive indirect competitors.
Related Guides and Calculators
Enhance your business strategy, financial modeling, and competitive analysis with our founder suite:
Frequently Asked Questions
The Bottom Line
Tracking market share provides clear feedback on whether your business is expanding faster than its industry or falling behind competitors. Always balance volume gains with solid unit economics by cross-referencing your operating metrics with our Break-Even Calculator and monitoring your cash reserves with our Burn Rate Calculator.
- Harvard Business Review: Market Share: A Key to Profitability by Robert D. Buzzell
- Boston Consulting Group (BCG): The Growth-Share Matrix Framework & Relative Scale
- Federal Trade Commission (FTC): Herfindahl-Hirschman Index (HHI) for Market Concentration
- U.S. Small Business Administration (SBA): Competitive Market Analysis & Sizing Guidelines
Disclaimer: This calculator is provided for strategic planning and educational modeling purposes only. It does not constitute formal antitrust, competitive appraisal, or corporate valuation advice. Verify market sizing parameters with verified primary and secondary industry research.