Startup Valuation Estimator: Pre-Money, Post-Money & Dilution Tool
This free startup valuation calculator estimates your company's pre-money valuation, post-money valuation, investor ownership equity, and founder dilution across standard equity rounds, revenue multiple models, and convertible SAFE notes. It helps founders price funding rounds accurately before entering angel or venture capital term sheet negotiations.
Who it's for: Early-stage startup founders, pre-seed entrepreneurs, angel investors, and advisers preparing for fundraising rounds, convertible notes, or equity pool adjustments.
Why use it:
- Prevent Excessive Founder Dilution: Calculate your exact post-investment equity share and avoid giving away board control or excessive ownership in early rounds.
- Master Pre-Money vs. Post-Money Math: Understand how post-money SAFE notes and option pool shuffles directly impact final founder stakes.
- Benchmark Realistic Market Valuations: Test revenue-multiple and scorecard scenarios to ensure your target funding pitch aligns with current angel and seed market standards.
How to Use the Startup Valuation Estimator
- Select Your Valuation Model: Choose Priced Round (Pre vs. Post) for equity financings and SAFE notes, or switch to Revenue Multiple Model if your startup has commercial traction, annual recurring revenue (ARR), or historical revenue benchmarks.
- Input Required Investment Capital: Enter the cash amount you plan to raise. Before deciding on this figure, calculate your exact operational runway and burn rate using our Startup Runway Calculator so you raise enough capital to reach your next value inflection point.
- Set Your Pre-Money Valuation: Input the agreed pre-money valuation. For early pre-seed startups, this typically ranges between $2M and $5M based on team pedigree, market size, and minimum viable product (MVP) progress.
- Configure the Employee Stock Option Pool (ESOP): Enter the percentage of unallocated options required by incoming investors (typically 10% to 15%). Most venture capitalists insist on creating this pool *before* their money goes in (the pre-money option pool shuffle), which dilutes existing founders rather than incoming investors.
- Review Post-Money Equity Stakes: The tool automatically computes your post-money capitalization, investor percentage ownership, retained founder shares, and cumulative dilution.
How It Works & Fundamental Valuation Formulas
At its core, equity valuation is an algebraic balance between capital injected and post-closing enterprise capitalization:
While later-stage businesses rely on discounted cash flow (DCF) or EBITDA multiples, early-stage startups with zero or negative operating earnings are valued through qualitative frameworks such as the Berkus Method (attributing up to $500k for idea, prototype, team, strategic relationships, and product rollout) or the Scorecard Valuation Method (benchmarking against comparable regional seed rounds).
Worked Example: Seed Round Pre-Money vs. Option Pool Shuffle
Imagine a B2B SaaS startup raising a Seed round to scale sales operations:
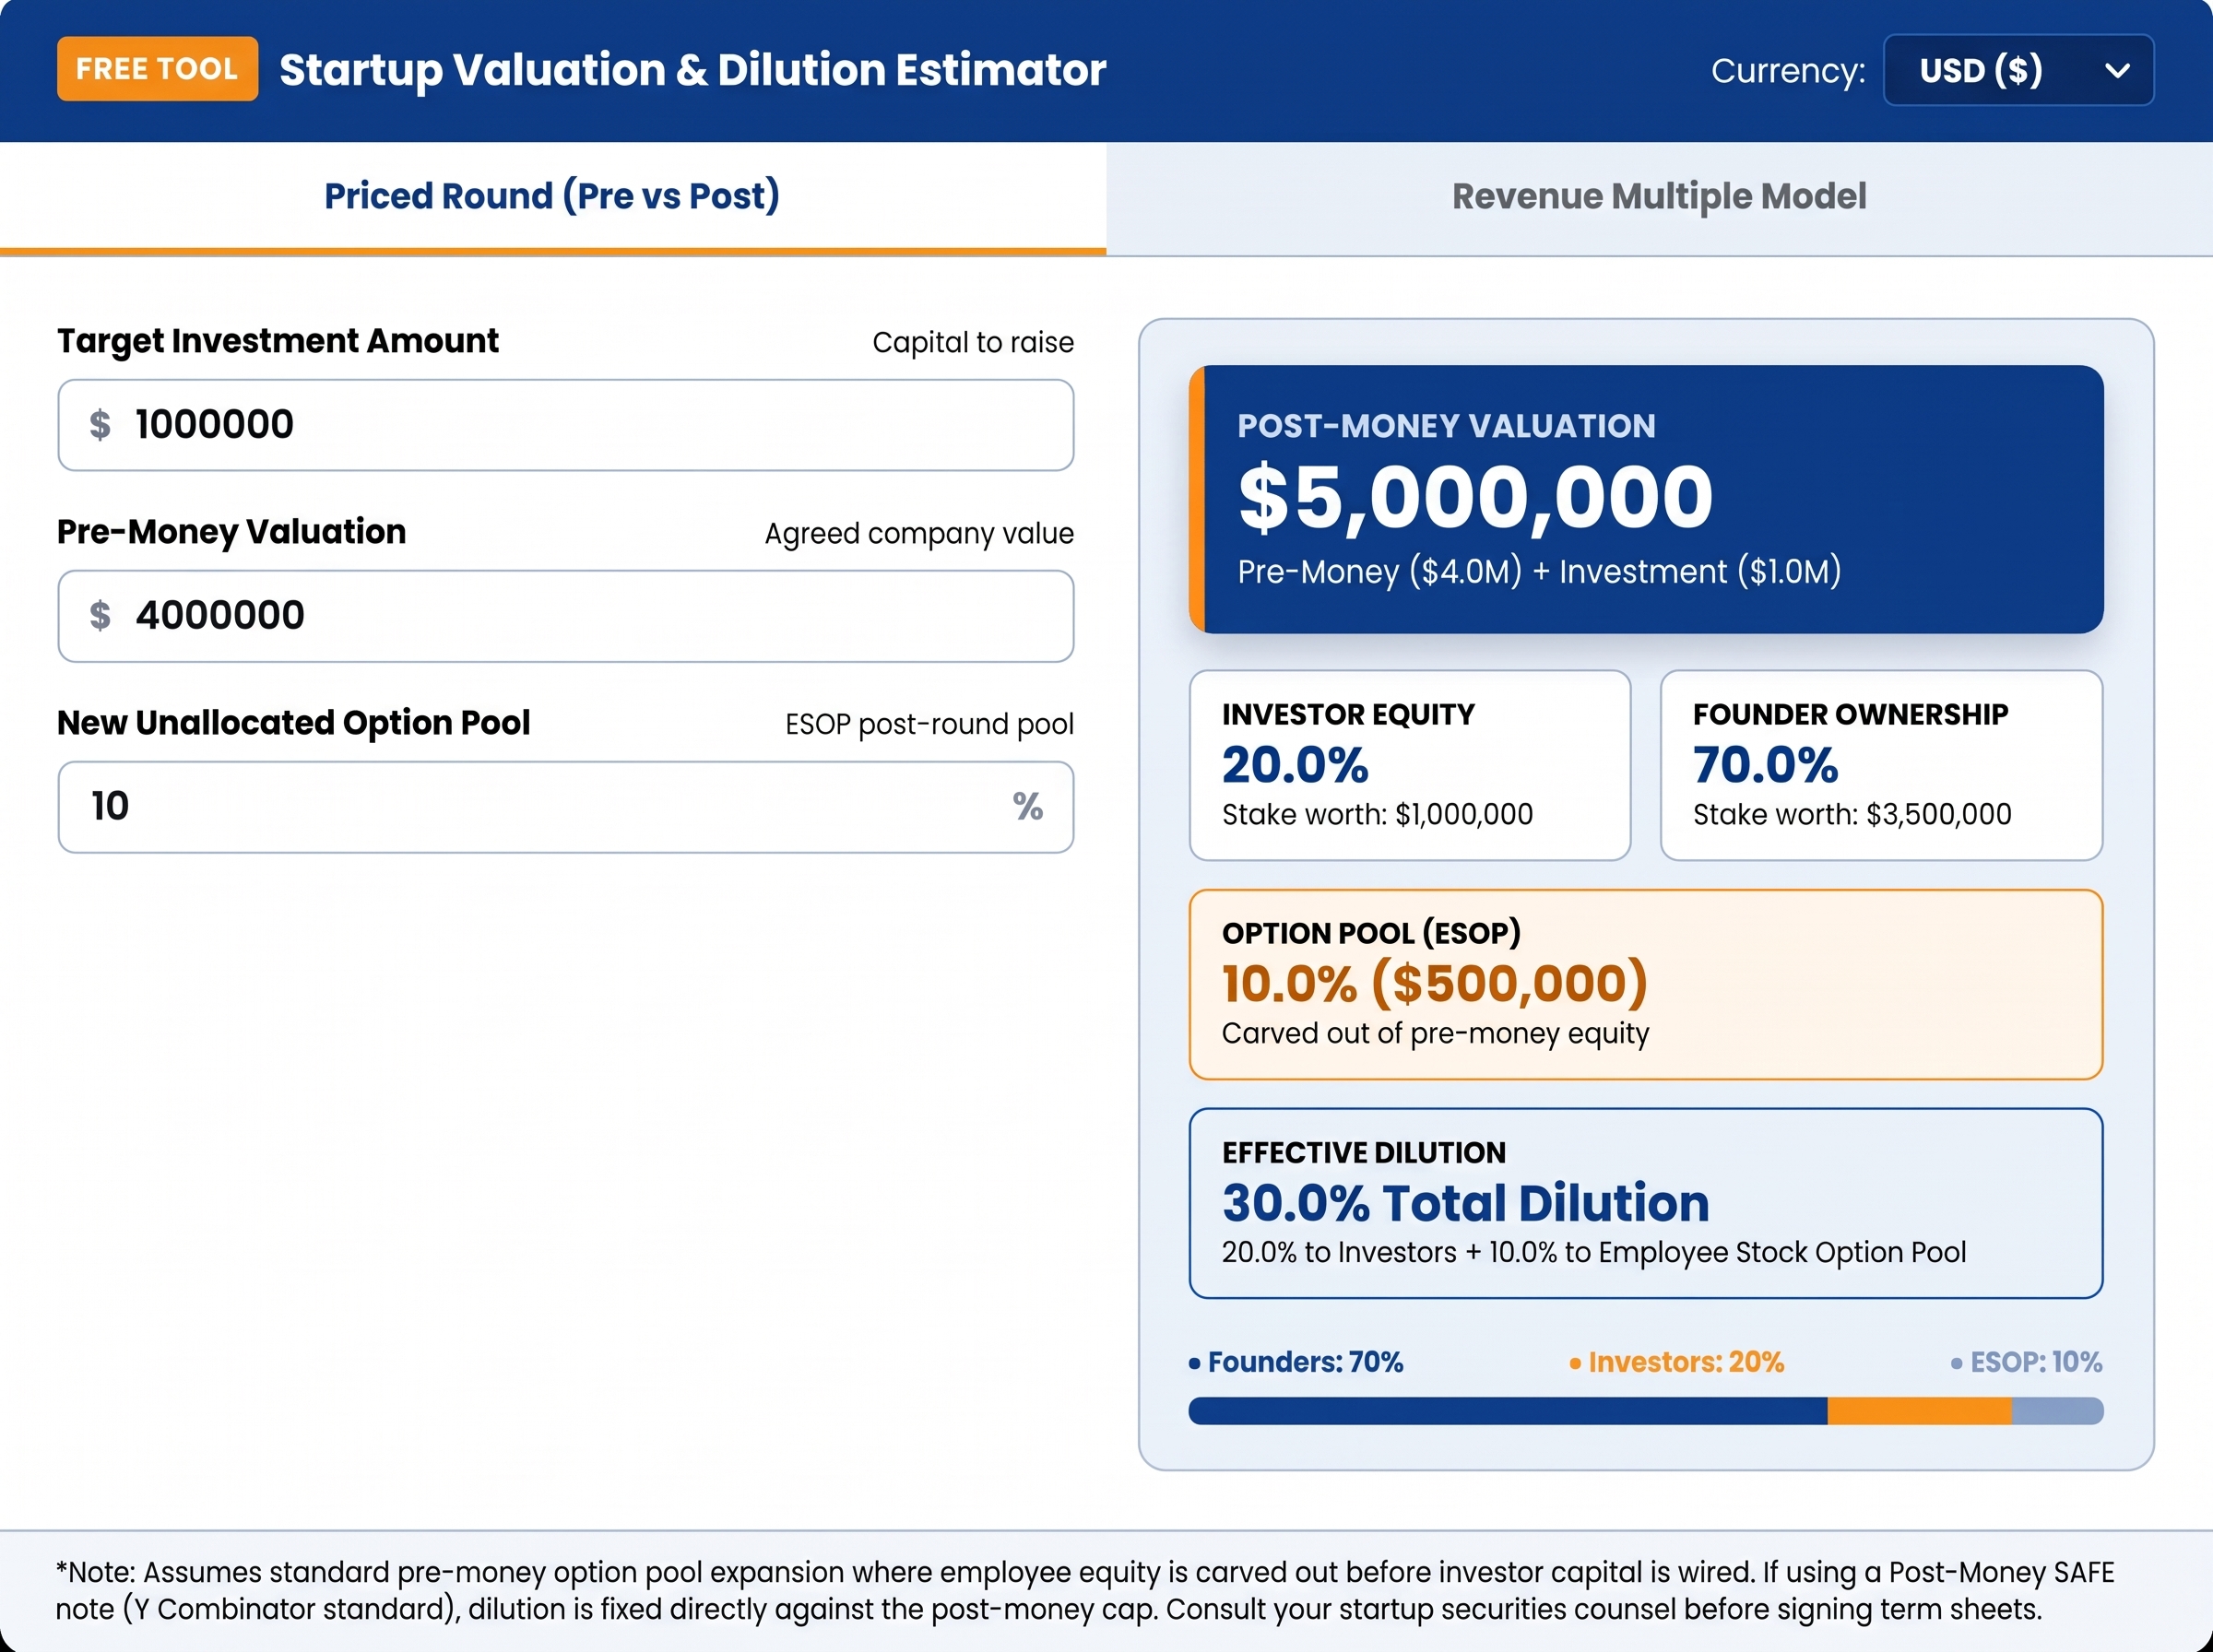
- Target Capital Inflow: $1,000,000 cash.
- Agreed Pre-Money Valuation: $4,000,000.
- Option Pool Requirement: The term sheet mandates a 10% unallocated post-closing option pool.
The Mathematical Breakdown:
- Post-Money Valuation = $4,000,000 + $1,000,000 = $5,000,000.
- Investor Equity = $1,000,000 ÷ $5,000,000 = 20.0%.
- Employee Option Pool = 10.0% ($500,000 in equity value).
- Founders' Retained Stake = 100% − 20% − 10% = 70.0% ($3,500,000 in value).
Founder Key Takeaway: Because the option pool was created out of the pre-money valuation, the effective pre-money valuation the founders accepted was actually $3,500,000—not $4,000,000. Understanding this difference saves founders hundreds of thousands of dollars in equity ownership.
Seed Stage Valuation Benchmarks (By Stage & Sector)
Startup valuations fluctuate depending on macro interest rate cycles, industry capital intensity, and team traction. Below are standard institutional benchmarks for technology and commercial startups:
| Funding Stage | Typical Pre-Money Range | Average Capital Raised | Expected Founder Dilution |
|---|---|---|---|
| Pre-Seed (Idea / MVP) | $1.5M – $3.5M | $250K – $750K | 10% – 18% |
| Seed (Early Traction / Early ARR) | $4.0M – $8.0M | $1.0M – $2.5M | 15% – 22% |
| Series A ($1M+ ARR / PMF) | $12.0M – $25.0M | $3.0M – $7.0M | 20% – 25% |
| Series B (Scalable Growth Engine) | $35.0M – $75.0M | $10.0M – $20.0M | 15% – 20% |
Where to Find Your Numbers
To produce an institutional-grade valuation model for investors and board presentations, collect verified data from your business records:
- For Revenue & Unit Economics: Pull trailing revenue, gross margins, and customer acquisition costs. Ensure your operating expenses are thoroughly modeled using our Break-Even Calculator so investors see a clear path to profitability.
- For Initial Capital Requirements: Confirm total infrastructure, legal, and operational setup costs through our Startup Cost Calculator to avoid arbitrary round sizing.
- For Financial Projections: Document your revenue assumptions, staffing plan, and 3-year P&L by following our detailed framework on How to Write a Business Plan.
What This Calculator Can and Cannot Tell You
What it tells you:
- Exact post-money capitalization resulting from pre-money equity or convertible pricing.
- Founder equity retention versus investor dilution after accounting for employee stock option pools (ESOP).
- Implied company enterprise valuation derived from industry ARR multiples and growth trajectory.
What it cannot tell you:
- Liquidation Preferences & Participating Debt: It models common share equivalents. It does not reflect 1x, 2x, or participating preferred liquidation multiples that give investors payout seniority during a fire sale.
- Multiple Convertible Note Stacking: If you have multiple SAFE notes with different valuation caps and discounts, they will dilute each other when converting simultaneously in a priced round.
- Subjective Investor Appetite: Valuation is ultimately what an investor is willing to wire into your bank account. Macro VC market liquidity matters as much as your spreadsheets.
Related Guides and Calculators
Optimize your fundraising, equity distribution, and operating cash flow with our founder suite:
Frequently Asked Questions
The Bottom Line
Valuation is not a badge of honor; it is a financing hurdle you must overcome in your next funding round. Price your company realistically based on verified milestones rather than vanity metrics. Model your runway carefully with our Startup Runway Calculator and understand your capitalization table so that every dollar of investor capital builds true founder wealth.
- National Venture Capital Association (NVCA): Standard Model Legal Documents (Term Sheet & Voting Rights)
- Y Combinator: Standard Post-Money SAFE (Simple Agreement for Future Equity) Guidelines
- SEC Regulation D: Rule 506(b) and 506(c) Private Placement Offering Standards
- PitchBook & NVCA Venture Monitor: U.S. Seed and Early-Stage Valuation Multiples & Deal Terms
Disclaimer: This calculator is provided for educational and strategic modeling purposes only. It does not constitute formal legal, securities, or financial valuation advisory. Always consult certified startup legal counsel and a registered CPA before signing term sheets or issuing cap table shares.