Quick answer: About 56% of U.S. families owned stocks in 2025, directly or through funds and retirement accounts, according to the Federal Reserve. Americans held $51.2 trillion in retirement assets in mid-2026, and index funds now hold most long-term fund money. But ownership is uneven: 97% of families in the top 10% of earners own stock, versus 31% in the bottom half.
Americans have trillions of dollars invested, and more of it sits in low-cost index funds than in actively managed ones. Yet the share of families who own any stock slipped between 2022 and 2025, and only about a third of non-retired adults think their retirement savings are on track.
This roundup collects the latest investing statistics from official and industry sources, including the Federal Reserve’s Survey of Consumer Finances, its household well-being survey, ICI, S&P Dow Jones Indices, and the FINRA Investor Education Foundation.
Investing Statistics at a Glance
Statistic | Figure | Source and date |
| Families owning stock, directly or indirectly | 56% (58% in 2022) | Federal Reserve SCF, 2025 |
| Families owning individual stocks directly | 19% | Federal Reserve SCF, 2025 |
| Median stock holdings, families that own stock | $77,400 | Federal Reserve SCF, 2025 |
| Families with a retirement account | 54.9% | Federal Reserve SCF, 2025 |
| Total U.S. retirement assets | $51.2 trillion | ICI, June 30, 2026 |
| IRA assets | $19.9 trillion | ICI, June 30, 2026 |
| 401(k) assets | $10.8 trillion | ICI, June 30, 2026 |
| Non-retirees who think retirement savings are on track | 35% | Federal Reserve SHED, 2025 |
| Households owning registered funds (mutual funds, ETFs, and others) | 56.4% (76.0 million) | ICI, 2025 |
| Index funds’ share of long-term fund assets | 52% | ICI, year-end 2025 |
| Active large-cap funds that trailed the S&P 500 over 20 years | 92.9% | S&P Dow Jones Indices, 2025 |
How Many Americans Own Stocks?
About 56% of U.S. families owned stocks in 2025, either directly or indirectly through mutual funds, retirement accounts, and other managed accounts, according to the Federal Reserve’s 2025 Survey of Consumer Finances (SCF), released in October 2026. That was down slightly from 58% in 2022.
Most of that ownership is indirect. Only 19% of families owned individual company shares directly in 2025. Everyone else who owned stock did so through a fund or a retirement plan such as a 401(k).
For families that did own stock, the amount grew. Their median stock holdings rose 36% from 2022 to 2025, from $56,900 to $77,400, according to the SCF.
The Fed runs the SCF every three years, so the 2025 survey remains the latest until the 2028 results.
Who Owns Stocks in America?
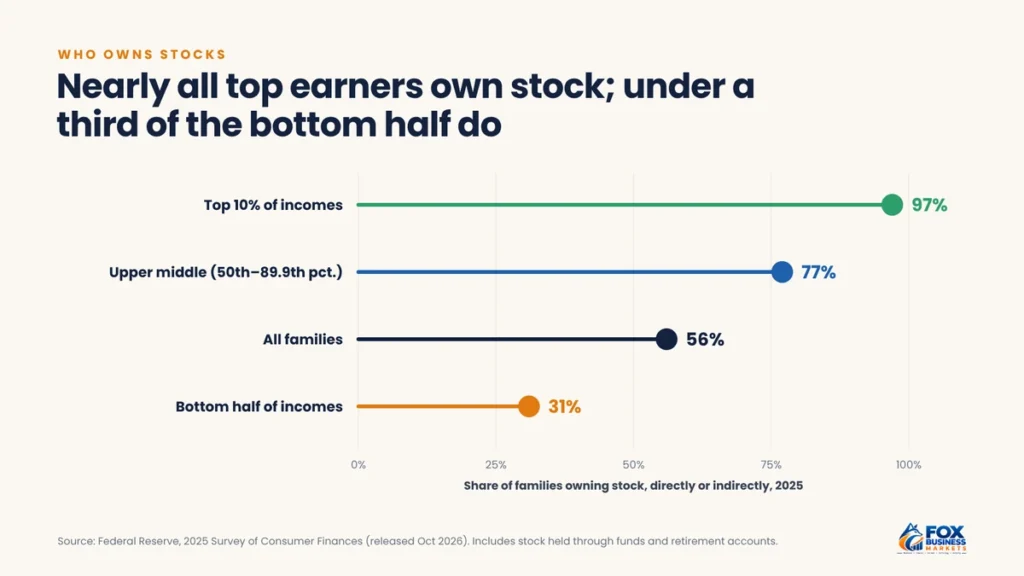
Stock ownership rises sharply with income. In 2025:
- Bottom half of the income distribution: 31% of families held stock
- Upper-middle group (50th to 89.9th percentile): 77%
- Top 10%: 97%
Source: Federal Reserve, Changes in U.S. Family Finances from 2022 to 2025.
Stock ownership is one of the main ways families build wealth over time. When markets rise, families who own no stock miss out on those gains entirely. Lower-income families are also less likely to have a workplace retirement plan, which is how many Americans start investing in the first place.
How Much Is in U.S. Retirement Accounts?
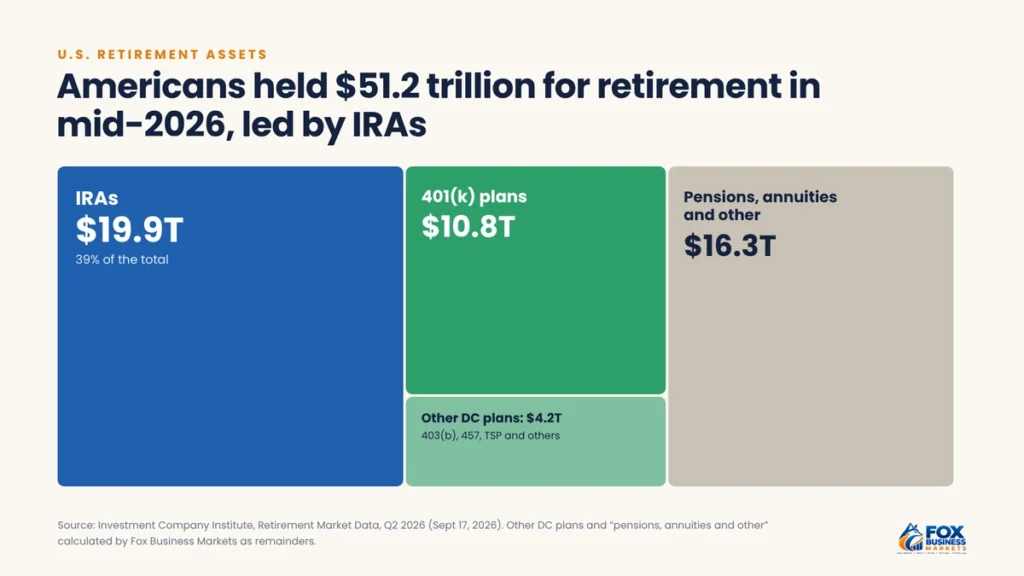
Total U.S. retirement assets reached $51.2 trillion on June 30, 2026, up 7.9% from the end of March, according to ICI’s quarterly retirement market data, released in September 2026. Retirement assets made up 33% of all household financial assets.
Retirement account type | Assets, June 30, 2026 | Change from March 31, 2026 |
| Individual retirement accounts (IRAs) | $19.9 trillion | +9.2% |
| Defined contribution plans | $15.0 trillion | +8.7% |
| Of which: 401(k) plans | $10.8 trillion | Not reported |
Source: Investment Company Institute. Defined contribution plans include 401(k), 403(b), and similar employer plans. The remaining assets are mostly pensions and annuity reserves.
Mutual funds are the main investment inside these accounts. They held 46% of IRA and defined contribution plan assets, or $15.9 trillion, including 58% of 401(k) assets, ICI reported.
At the family level, 54.9% of families had a retirement account such as a 401(k) or IRA in 2025, according to the SCF. Among families with one, the median balance was $106,000. Including traditional pensions, about 65% of families participated in some kind of retirement plan.
How Many Households Own IRAs?
About 44.2% of U.S. households, or 59.6 million, owned an individual retirement account in mid-2025, according to ICI’s report The Role of IRAs in US Households’ Saving for Retirement, 2025. Traditional IRAs were more common than Roth IRAs:
IRA type | Households owning (mid-2025) | Share of U.S. households |
| Any IRA | 59.6 million | 44.2% |
| Traditional IRA | 43.9 million | 32.6% |
| Roth IRA | 37.5 million | 27.8% |
Source: Investment Company Institute. Many households own both types.
Rollovers drive much of that money. 61% of households with a traditional IRA said it held assets rolled over from an employer plan, usually after changing jobs or retiring. Among households with traditional or Roth IRAs, median IRA holdings were $100,000, ICI found.
Are Americans on Track for Retirement?
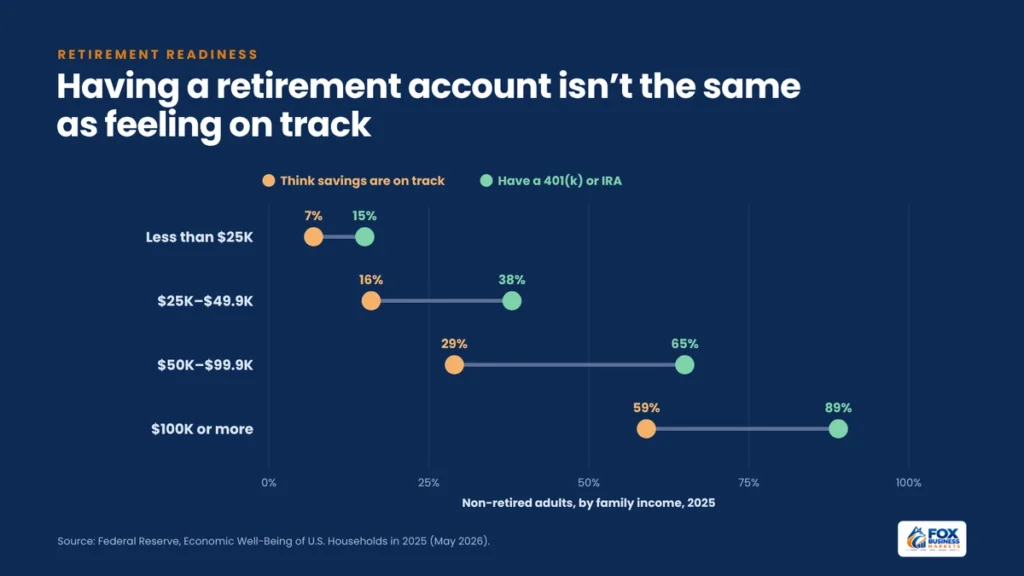
Most aren’t, by their own account. In 2025, 61% of non-retired adults had a tax-preferred retirement account such as a 401(k) or IRA, but only 35% thought their retirement savings plan was on track, according to the Federal Reserve’s Survey of Household Economics and Decisionmaking (SHED), published in May 2026.
The share who felt on track was unchanged from 2024 and down from 40% in 2021, according to the report’s executive summary. The gaps by income are wide:
Family income | Have a 401(k), IRA, or Roth IRA | Think retirement savings are on track |
| Less than $25,000 | 15% | 7% |
| $25,000–$49,999 | 38% | 16% |
| $50,000–$99,999 | 65% | 29% |
| $100,000 or more | 89% | 59% |
Source: Federal Reserve SHED, 2025. Non-retired adults.
Even among adults earning $100,000 or more, about four in ten didn’t think they were on track.
How Big Are Mutual Funds and ETFs?
U.S.-registered investment companies held $45.1 trillion at the end of 2025, according to ICI’s 2026 Investment Company Fact Book. Mutual funds accounted for $31.4 trillion and ETFs for $13.4 trillion.
Fund ownership is widespread. In 2025, 76.0 million U.S. households, or 56.4%, owned registered funds, including 128.7 million individual investors. ETFs had a record $1.5 trillion in net share issuance in 2025, up from $1.1 trillion in 2024, a sign of how quickly investors are adding to them.
Are Index Funds Taking Over?
Yes, by assets. Index mutual funds and index ETFs held $19.1 trillion at the end of 2025, or 52% of all assets in long-term funds, according to ICI. That’s up from 28% in 2015.
- In 2025, index equity mutual funds charged an asset-weighted average expense ratio of 0.05%, and index equity ETFs 0.14%, compared with 0.64% for actively managed equity mutual funds, according to ICI.
- Over the 20 years through 2025, 92.9% of actively managed U.S. large-cap funds trailed the S&P 500, according to S&P Dow Jones Indices’ SPIVA U.S. Scorecard. In 2025 alone, 78.8% underperformed. Small-company fund managers fared little better over the long run: 90.3% of small-cap funds trailed the S&P SmallCap 600 over 20 years.
Our guide to index funds explains how they work and how to choose one.
How Comfortable Are Americans With Investing?
Many adults hold investments without feeling confident about them. In the SHED, 47% of adults said they were mostly or very comfortable choosing and managing their own investments, while 53% were not comfortable or only slightly comfortable.
For many adults, a workplace plan is their only investment, often managed through a default option like a target-date fund.
Knowledge gaps show up in testing too. In the FINRA Investor Education Foundation’s 2024 National Financial Capability Study, investors with non-retirement accounts answered an average of 5.3 out of 11 investing knowledge questions correctly. More than half missed the questions on buying on margin and short selling.
How Many Adults Invest Outside Retirement Accounts?
About a third. In the FINRA Foundation’s 2024 survey, 34% of U.S. adults had a non-retirement investment account, roughly unchanged from 35% in 2021. The Fed’s SHED, which asks the question differently, found that 37% of adults held stocks, bonds, ETFs, or mutual funds outside a retirement account in 2025.
Participation among younger adults slipped. 26% of adults under 35 had a non-retirement investment account in 2024, down from 32% in 2021, according to the FINRA Foundation.
What Do Investors Own and How Do They Trade?
Among U.S. adults with investment accounts outside retirement plans, individual stocks are the most common holding, according to the FINRA Foundation’s 2024 investor survey:
Investment | Share of investors who own it (2024) | 2021 |
| Individual stocks | 80% | 79% |
| Mutual funds | 57% | 58% |
| ETFs | 31% | 32% |
| Cryptocurrency | 27% | 27% |
| Have traded options | 21% | 19% |
| Have bought on margin | 10% | 11% |
Source: FINRA Investor Education Foundation, 2024 National Financial Capability Study investor survey. Investors with non-retirement accounts.
Most of these investors trade online. 62% used a website and 46% a mobile app, while 45% traded through a specific financial professional. Only 20% had ever checked a professional’s background with a regulator, up from 18% in 2021 but below 23% in 2018.
Long-term goals still dominate. 96% said they invest for long-term gains, though 73% also cited short-term gains, and 31% said they invest partly for entertainment.
How Are New and Young Investors Behaving?
Fewer people are starting to invest than during the 2020–2021 boom. In FINRA Foundation research released in December 2025, 8% of investors with non-retirement accounts said they began investing within the previous two years, down from 21% in the 2021 survey.
Investors under 35 behave very differently from older ones, according to the same study:
Behavior | Investors under 35 | Investors 55 and older |
| Trade options | 43% | 10% |
| Buy on margin | 22% | 4% |
Source: FINRA Investor Education Foundation, 2024 National Financial Capability Study investor survey.
Younger investors are also more likely to say they need to take big risks to reach their goals: 62% agreed. Yet only 15% of investors under 35 said they were willing to take substantial risks, down from 24% in 2021 (8% of all investors, down from 12%).
Do Men and Women Invest Differently?
In some ways, yes. The FINRA Foundation found that among investors with non-retirement accounts:
- 43% of men made four or more trades in the past year, compared with 26% of women
- 24% of men had traded options, compared with 17% of women
- 16% of men had bought meme stocks or other viral investments, compared with 9% of women
- 47% of men said U.S. markets are fair, compared with 31% of women
Confidence fell overall: 56% of investors rated their knowledge as high in 2024, down from 64% in 2021.
Are Most Investors Active Traders?
No. The investors who trade options and chase viral stocks get the most attention online, but they aren’t typical. Most American stock ownership is passive and long-term, held through 401(k)s, IRAs, and funds rather than traded day to day.
Even among people with their own brokerage accounts, frequent trading is a minority habit. In the FINRA Foundation’s 2024 survey, 36% made four or more trades in the past year, down from 38% in 2021, and 96% said they invest for long-term gains. For most families, the biggest investing decisions are how much to put into a workplace plan and which low-cost funds to choose.
What Do These Investing Statistics Mean for You?
A few practical takeaways stand out from the data:
- Getting started is the biggest step. Almost half of families own no stock at all. If that’s you, our guide on how to start investing walks through the first steps.
- Use the accounts built for retirement. Workplace plans and IRAs hold most American investment money for a reason: tax breaks and automatic contributions. Our comparison of a Roth IRA vs. traditional IRA can help you choose.
- Keep costs low. The gap between a 0.05% and a 0.64% fee compounds over decades. Our explainer on compound interest shows how small differences grow.
- Don’t confuse activity with progress. Options, margin, and viral stocks are common among young investors, but most long-term wealth comes from steady contributions to diversified funds.
For more on how American households are doing overall, see our personal finance statistics.
Frequently Asked Questions
How did the stock market do in 2025?
The S&P 500 returned about 18% in 2025, including dividends, and set 39 record closing highs during the year, according to S&P Dow Jones Indices. Keep investing on a regular schedule rather than trying to time strong years.
Would most investors recognize an investment scam?
Not reliably. In the FINRA Foundation’s 2024 survey, 37% of investors worried about losing money to fraud, up from 31% in 2021. Yet half of investors said they would invest in an offer promising a “guaranteed, risk-free 25% annual return,” and another 30% weren’t sure. Among investors who rated their knowledge highly, 51% failed to recognize fraud warning signs. Treat any guaranteed high return as a red flag.
Do investors rely on social media for advice?
Many do. In the FINRA Foundation’s 2024 survey, 29% of investors relied on social media for investing information, and 26% used recommendations from social media influencers. Among investors under 35, 61% used influencer recommendations. Check any tip against an independent source, and look up advisers on FINRA BrokerCheck.
How much do fund-owning households have invested?
The median mutual fund-owning household held $125,000 in mutual funds in 2025, according to ICI. Half had more and half had less. Set your own target by your age, income, and goals rather than the median.
Check Where You Stand and Take One Step This Month
The data shows a country where investing is widespread but uneven, and where most money sits quietly in retirement accounts and low-cost funds. If you’re not investing yet, open an account and set up a small automatic contribution. If you already are, check your fees, confirm you’re getting any employer match, and raise your contribution rate by a point.
This article is for general information only and isn’t financial, tax, legal, or investment advice. Consider your own situation or talk to a qualified professional before making decisions.

