Almost every American shops online now. In a 2025 Pew Research Center survey of more than 9,000 US adults, 92% said they buy things online. But the same survey found that 36% had bought something online that never arrived or turned out to be counterfeit, and didn’t get their money back (Pew Research Center).
That gap between habit and trust runs through the latest ecommerce statistics. Online sales keep growing faster than retail overall, phones and AI assistants are changing how people shop, and shoppers are quick to abandon a cart or send an order back. Here are the numbers that matter for 2026, each with its source, plus a few popular claims you should stop repeating.
Key Ecommerce Statistics at a Glance
Statistic | Figure | Source |
| US ecommerce sales, Q2 2026 | $340.2 billion | Census Bureau |
| Ecommerce share of US retail, Q2 2026 | 17.1% | Census Bureau |
| Ecommerce growth vs. total retail (year over year) | +12.2% vs. +6.7% | Census Bureau |
| US adults who shop online | 92% | Pew Research Center |
| 2025 holiday online spending | $257.8 billion | Adobe (vendor) |
| 2026 holiday online spending forecast | $275.1 billion | Adobe (vendor) |
| Holiday spending on mobile devices, 2025 | 56.4% | Adobe (vendor) |
| Average cart abandonment rate | 70.22% | Baymard Institute |
| Share of online sales expected to be returned, 2025 | 19.3% | NRF and Happy Returns |
| Amazon units sold by third-party sellers, Q4 2025 | 61% | Amazon |
US Ecommerce Sales Statistics
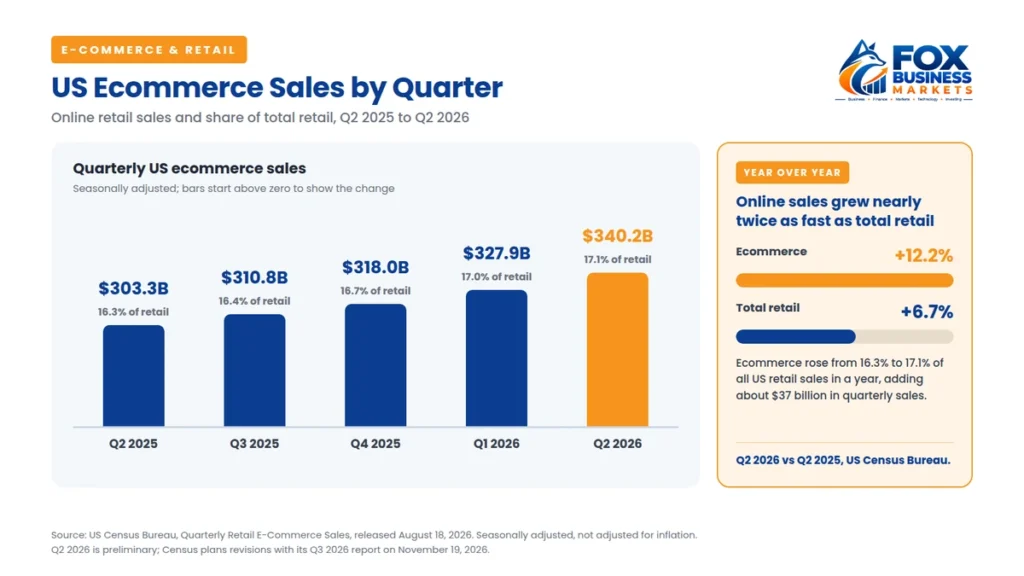
US ecommerce sales reached $340.2 billion in the second quarter of 2026, according to the Census Bureau. That was 17.1% of all retail sales, and it was up 12.2% from a year earlier, while total retail sales grew 6.7% (Census Bureau). Census counts a sale as ecommerce when the order is placed online, even if payment happens later.
Online sales have grown every quarter over the past year:
Quarter | Ecommerce sales | Share of retail |
| Q2 2025 | $303.3 billion | 16.3% |
| Q3 2025 | $310.8 billion | 16.4% |
| Q4 2025 | $318.0 billion | 16.7% |
| Q1 2026 | $327.9 billion | 17.0% |
| Q2 2026 | $340.2 billion | 17.1% |
These figures are seasonally adjusted and not adjusted for inflation. The Q2 2026 number is preliminary, and Census will publish revisions with its third-quarter report on November 19, 2026.
The longer view shows how much has changed. In the second quarter of 2019, ecommerce was 10.3% of retail. It spiked to 16.3% during the 2020 pandemic, dipped to 14.2% in 2022, and has climbed every year since (FRED, Census data).
Holiday and Big-Event Spending
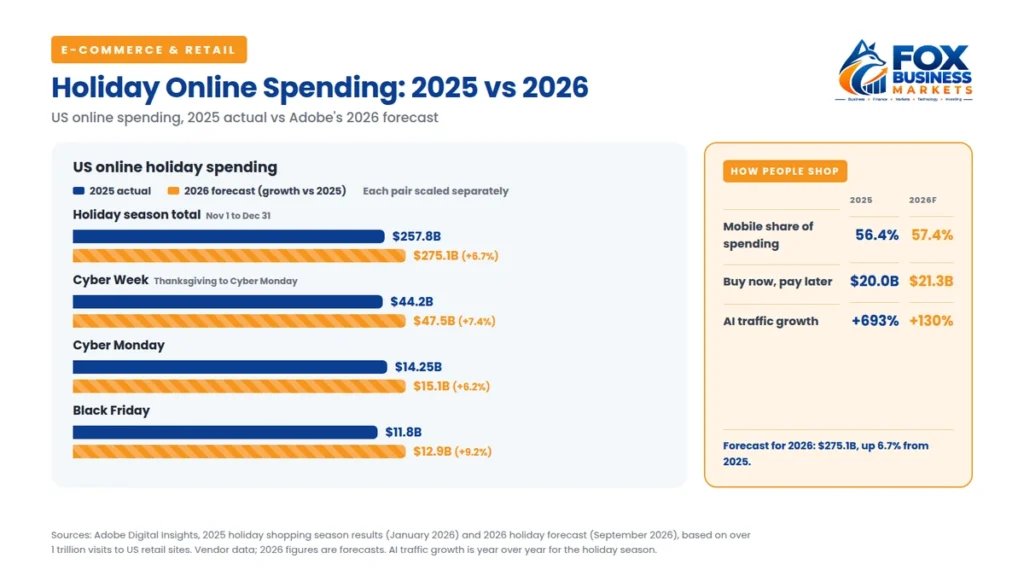
These ecommerce statistics come from Adobe, which tracks more than a trillion visits to US retail sites. US shoppers spent $257.8 billion online during the 2025 holiday season, from November 1 to December 31, up 6.8%. Cyber Monday alone brought in $14.25 billion, up 7.1%, and Black Friday added $11.8 billion (Adobe).
For the 2026 holiday season, Adobe forecasts $275.1 billion in online spending, up 6.7%, with Cyber Monday reaching about $15.1 billion (Adobe). That’s a forecast, not a result.
Big sales events matter outside the holidays too. Adobe reported $26.4 billion in US online spending during Amazon’s four-day Prime Day event in June 2026, up 9.3% from the year before (Adobe).
Mobile and Payment Statistics
Phones now carry most online shopping. Mobile devices accounted for 56.4% of online holiday spending in 2025, up from 54.5% the year before, and Adobe expects 57.4% in 2026.
Buy now, pay later (BNPL) is growing too. BNPL means splitting a purchase into installments, often with no interest. Adobe counted $20 billion in BNPL spending during the 2025 holiday season, up 9.8%. The latest government data on BNPL, from the Consumer Financial Protection Bureau, covers 2023: six large lenders made 335.8 million BNPL loans worth $45.2 billion that year (CFPB).
Cards still dominate overall. In the Federal Reserve’s 2026 Diary of Consumer Payment Choice, debit and credit cards made up about two-thirds of all consumer payments, and cash about one in seven (Federal Reserve).
AI Shopping Statistics
AI assistants are becoming a new front door for online stores. Adobe found that traffic from generative AI tools to US retail sites jumped 693% during the 2025 holiday season. By July 2026, visitors arriving from AI tools converted to a sale 60% more often than visitors from other sources, and 42% of consumers in Adobe’s survey said they had used an AI assistant for online shopping (Adobe).
Local shopping is shifting as well. In BrightLocal’s 2026 survey of US consumers, 45% said they had used ChatGPT or other AI tools for local business recommendations, up from 6% the year before (BrightLocal). Both are vendor surveys, so treat them as direction, not precise measurements.
Cart Abandonment Statistics
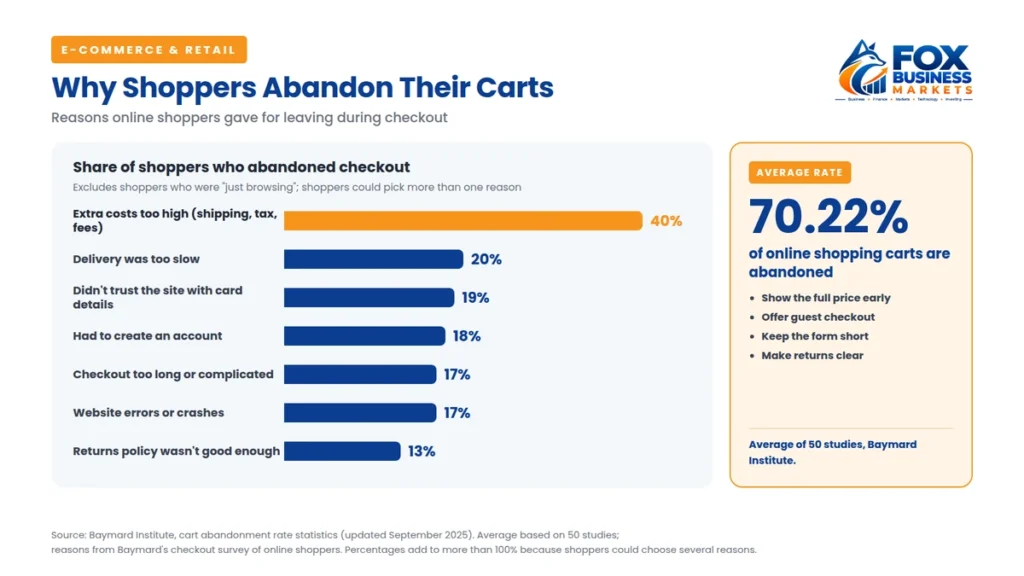
About seven in ten online shopping carts are abandoned. The Baymard Institute’s average across 50 studies is 70.22% (Baymard Institute). Leaving aside people who were just browsing, the main reasons shoppers gave were:
Reason for abandoning checkout | Share of shoppers |
| Extra costs too high (shipping, tax, fees) | 40% |
| Delivery was too slow | 20% |
| Didn’t trust the site with card details | 19% |
| Site required creating an account | 18% |
| Checkout was too long or complicated | 17% |
| Website errors or crashes | 17% |
| Returns policy wasn’t satisfactory | 13% |
Most of these are fixable. Show the full price early, offer guest checkout, and keep the form short.
Ecommerce Return Statistics
Returns are one of the biggest hidden costs of selling online. The National Retail Federation and Happy Returns estimated that consumers would return $849.9 billion in merchandise in 2025, or 15.8% of all retail sales. For online sales, the expected return rate was higher, at 19.3% (NRF). The estimate is based on surveys of consumers and ecommerce professionals.
Marketplace and Retailer Statistics
A few platforms handle much of US online shopping, and small sellers power a big share of it.
- Amazon: Third-party sellers accounted for 61% of the units sold on Amazon in the fourth quarter of 2025, a worldwide figure. Amazon’s total net sales reached $716.9 billion in 2025 (Amazon).
- Etsy: The Etsy marketplace reported 5 million active buyers and 5.6 million active sellers for 2025, with $10.46 billion in gross merchandise sales (Etsy, SEC filing).
- Shopify: Merchants on Shopify sold about $378 billion in goods in 2025, up 29%, according to CEO remarks on the company’s February 2026 earnings call.
- Walmart: Walmart’s US ecommerce sales grew 24% in the quarter ending July 31, 2026 (Walmart).
If you’re choosing where to sell, our comparison of the best ecommerce platforms breaks down the fees.
Retail Media and Social Commerce
Retailers are now major ad sellers. Commerce and retail media advertising, such as sponsored product listings on Amazon or Walmart, grew 18% to $63.4 billion in 2025, according to the IAB and PwC (IAB).
Social shopping is growing but hard to measure. TikTok said its TikTok Shop had more than $500 million in sales over the 2025 Black Friday to Cyber Monday weekend (TikTok). There’s no official annual figure for US social commerce sales.
Shipping Statistics
The US shipped about 23.1 billion parcels in 2025, up 3.3%, according to Pitney Bowes’ Parcel Shipping Index. Amazon delivered the most, at 6.9 billion parcels, ahead of the US Postal Service at 6.2 billion (Pitney Bowes). USPS itself reported a 5.7% drop in shipping and package volume in fiscal 2025 (USPS).
Ecommerce Statistics You Should Stop Repeating
Some ecommerce statistics get copied without anyone checking them:
- “Ecommerce is 25% to 30% of retail.” The official Census figure is 17.1% (Q2 2026). Higher numbers usually leave out categories like cars, gas, and restaurants. If you see one, check what’s excluded.
- “95% of purchases will be online by 2040.” This traces back to a 2017 forecast with no published method.
- “Nonstore retailers” sales equal online sales. They don’t. Census’s nonstore category includes catalog and direct sellers, and it measures types of businesses, not how orders are placed.
What These Ecommerce Statistics Mean for Small Sellers
Online is still the growth channel. Ecommerce grew nearly twice as fast as total retail over the past year. If you sell only in person, a simple online store can extend your reach. Our guide on how to start an ecommerce business covers the basics.
Design for phones first. More than half of holiday spending happens on mobile, so test your checkout on a phone before anything else.
Trust sells. With a third of shoppers burned by online scams, clear photos, real reviews, honest delivery times, and a visible returns policy are worth more than a discount.
Don’t ignore stores. About 83% of retail sales still happen outside ecommerce. See our guide on how to open a retail store, and our marketing statistics for where customers find you.
Frequently Asked Questions
What percentage of retail sales are online in 2026?
Ecommerce made up 17.1% of total US retail sales in the second quarter of 2026, according to the Census Bureau. That’s up from 16.3% a year earlier and 10.3% in the second quarter of 2019.
How much do Americans spend online?
US ecommerce sales were $340.2 billion in the second quarter of 2026 alone, seasonally adjusted, according to the Census Bureau. During the 2025 holiday season, Americans spent $257.8 billion online, according to Adobe.
What is the average cart abandonment rate?
The Baymard Institute’s average across 50 studies is 70.22%. The most common reason shoppers give is extra costs such as shipping, taxes, and fees, cited by 40% of those who abandoned a checkout.
How many online purchases are returned?
The National Retail Federation and Happy Returns estimated that 19.3% of online sales would be returned in 2025, compared with 15.8% of all retail sales.
What share of online shopping happens on mobile?
Mobile devices accounted for 56.4% of US online holiday spending in 2025, according to Adobe, and Adobe forecasts 57.4% for the 2026 holiday season.
Where do these ecommerce statistics come from?
They come from government sources such as the Census Bureau, Federal Reserve, and CFPB; research groups like Pew Research Center; industry groups like the NRF and IAB; company filings from Amazon, Etsy, and Walmart; and vendors like Adobe, Baymard, BrightLocal, and Pitney Bowes. We note vendor data where it appears.
The Bottom Line
The headline ecommerce statistics are about growth: more sales, more mobile, more AI. But the number to remember is the one we started with. Nearly every American shops online, and more than a third have been burned doing it. For a small seller, that’s an opening: the store that feels trustworthy, ships when it says it will, and makes returns easy can compete with anyone.