For most of the internet’s history, search was the biggest category of online advertising in the US. In 2025, that changed. Social media ad revenue reached $117.7 billion, up 32.6% in a single year, and passed search at $114.2 billion for the first time, according to the IAB and PwC (IAB).
That one shift says a lot about where marketing is heading. The latest marketing statistics show money moving toward social feeds, creators, and video; AI changing how people search; and customers leaning harder than ever on reviews. Below are the numbers that matter for 2026, each with its source, plus a few popular “stats” you should stop repeating.
Key Marketing Statistics at a Glance
Statistic | Figure | Source |
| US internet ad revenue (2025) | $294.6 billion, up 13.9% | IAB/PwC |
| Social media ad revenue (2025) | $117.7 billion, now ahead of search | IAB/PwC |
| Expected US ad spend growth (2026) | 12.3% | IAB |
| Marketing budget as share of revenue | 7.8% (mostly $1B+ companies) | Gartner |
| US adults who use YouTube | 84% | Pew Research Center |
| Google users who click a result when an AI summary appears | 8%, vs. 15% without one | Pew Research Center |
| ChatGPT weekly active users | More than 900 million | OpenAI |
| Consumers who read reviews for local businesses | 97% | BrightLocal (vendor) |
| Small employer firms using AI | 46% | Federal Reserve |
| E-commerce share of US retail sales (Q2 2026) | 17.1% | US Census Bureau |
Advertising Spending Statistics
US internet advertising revenue reached $294.6 billion in 2025, up 13.9% and “the highest level in the report’s history,” according to the IAB and PwC’s annual report. The breakdown:
Format | 2025 revenue | Growth |
| Social media | $117.7 billion | +32.6% |
| Search | $114.2 billion | +11.0% |
| Display | $81.6 billion | +9.8% |
| Digital video (including CTV) | $78.0 billion | +25.4% |
| Commerce and retail media | $63.4 billion | +18.0% |
| Digital audio | $8.4 billion | +10.2% |
| Podcasts | $2.9 billion | +17.6% |
Categories overlap, so they don’t sum to the total. Creators are a fast-growing piece: the IAB estimates $37 billion in creator ad spend in 2025, projected to reach $44 billion in 2026.
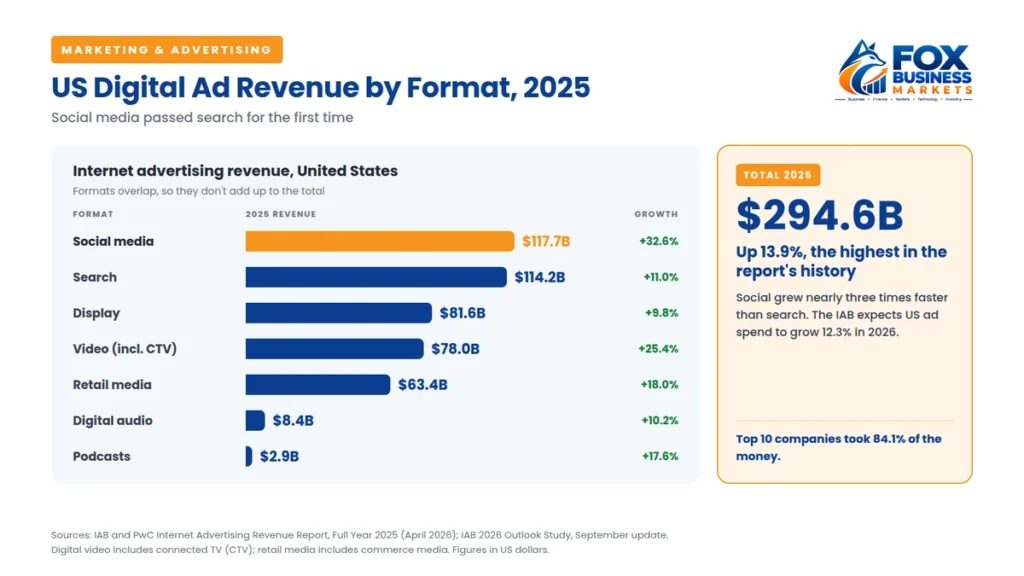
The money is concentrated. The top 10 companies took 84.1% of US internet ad revenue in 2025 (IAB/PwC report). For a small business, that means most of your ad budget will likely end up with a handful of platforms, so learning one or two of them well matters more than spreading thin.
Growth isn’t slowing. In September 2026, the IAB raised its forecast for US ad spend growth in 2026 to 12.3%, up from 9.5% in January. Buyers expect social to grow 16.5%, connected TV 15.6%, and paid search 8.1% (IAB). Those are survey-based plans from ad buyers, not final numbers.
Marketing Budget Statistics
How much do companies spend on marketing? Gartner’s 2026 CMO Spend Survey found marketing budgets averaged 7.8% of company revenue, up from 7.7% in 2025. CMOs said they put “an average of 15.3% of marketing budgets to AI initiatives,” but “only 30% report mature or fully developed AI readiness capabilities” (Gartner).
The Spring 2026 CMO Survey, run by Duke University’s Fuqua School of Business, put marketing at 9.0% of revenue for US companies. Social media made up 14.3% of marketing budgets, and marketers expected that to reach 17.1% within a year. AI was used in 24.2% of marketing activities, up from 13.1% in 2024 (The CMO Survey).
One warning: most of Gartner’s respondents work at companies with more than $1 billion in revenue, and the CMO Survey also leans toward larger firms. These marketing statistics are useful reference points, not a rule for a five-person business. Our guide on how to create a marketing plan explains a better way to set a small business budget.
Social Media Marketing Statistics
Pew Research Center’s 2025 survey of more than 5,000 US adults found these usage rates (Pew Research Center):
Platform | US adults who use it |
| YouTube | 84% |
| 71% | |
| 50% | |
| TikTok | 37% |
| 32% | |
| 26% |
Daily habits matter more than sign-ups. About half of US adults use Facebook daily, and 37% use it several times a day. About half also use YouTube daily. TikTok’s daily users came to 24% of adults.
Younger audiences live on different platforms. Among US teens ages 13 to 17, 61% use TikTok daily, and 21% say they’re on it “almost constantly” (Pew Research Center).
Search and AI Search Statistics
AI summaries are changing how people use search. In a Pew Research Center study of 900 US adults’ browsing in March 2025, people who saw a Google AI summary clicked a traditional search result in 8% of visits, compared with 15% when no summary appeared. They clicked a link inside the summary only about 1% of the time, and they were more likely to end their browsing session (Pew Research Center).
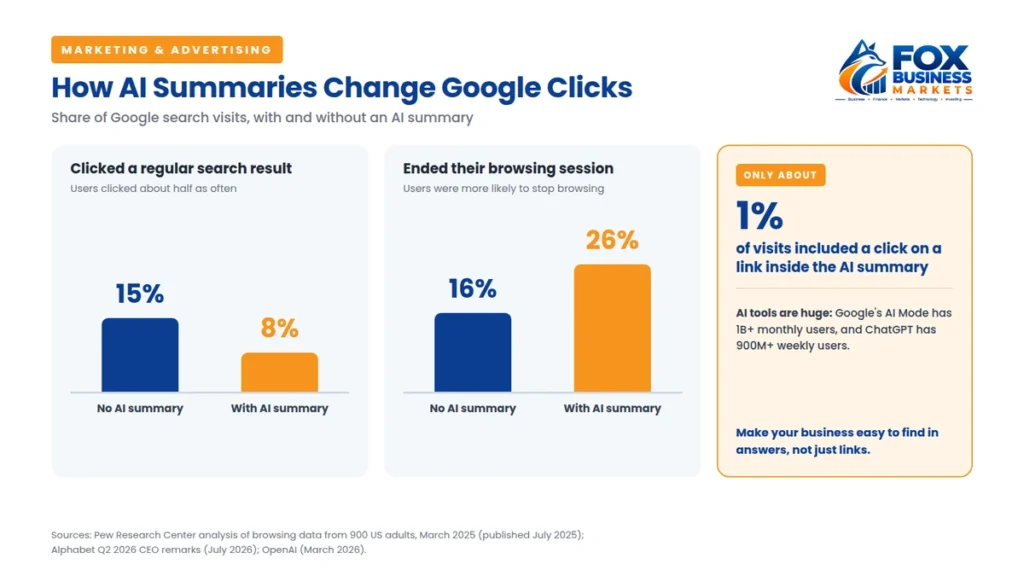
The audience for AI tools is huge. Google says its AI Mode has “surpassed 1 billion monthly active users” (Google). OpenAI reported in March 2026 that ChatGPT had “more than 900 million weekly active users” (OpenAI).
SEO isn’t dead, but as fewer searches end in a click, showing up in AI answers, reviews, and your Google Business Profile matters more.
Email Marketing Statistics
Email benchmarks come mostly from email software companies, so treat them as rough guides. Klaviyo, based on more than 183,000 customers (mostly online stores), says that “in 2026, a good email open rate is 31% for campaigns and 32.2% for flows.” A good click rate is 1.69% for campaigns and 5.58% for automated flows. Automated flows produced about 41% of email revenue from just 5.3% of sends (Klaviyo).
A few automated emails, like a welcome series or a cart reminder, can outperform dozens of one-off newsletters. Apple’s Mail Privacy Protection inflates open rates, so track clicks and sales instead.
Customer Review Statistics
Reviews are close to mandatory for local businesses. In BrightLocal’s 2026 survey of 1,002 US consumers, 97% said they read reviews for local businesses, and 41% said they “always” do, up from 29% the year before (BrightLocal).
The bar is rising:
- 68% require at least a 4-star rating before using a business.
- 31% will only use a business rated 4.5 stars or higher, up from 17% in 2025.
- 74% want to see reviews from the last three months.
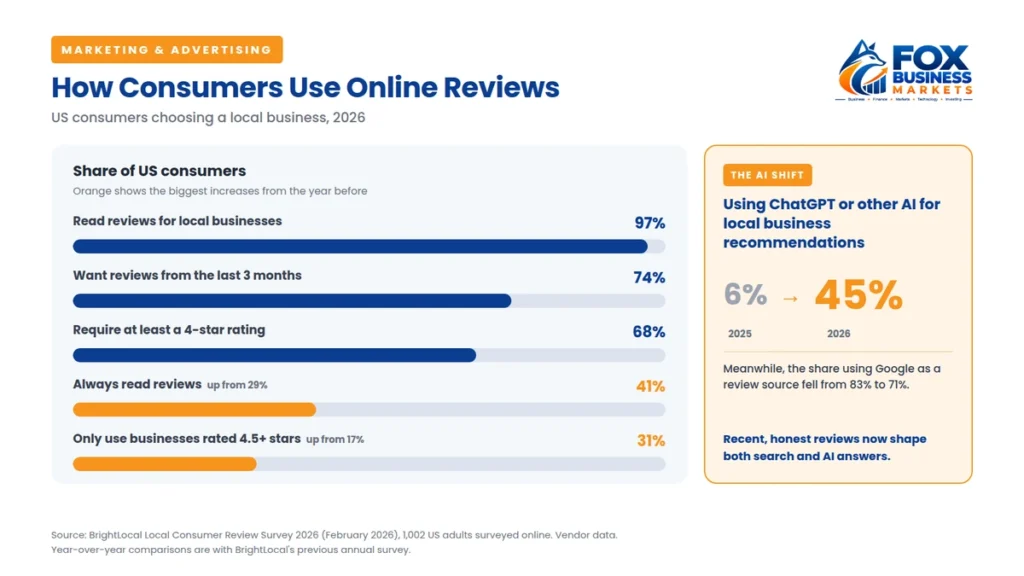
AI is changing this too. The share of consumers using ChatGPT or other AI tools for local business recommendations jumped from 6% to 45%, while the share using Google as a review source fell from 83% to 71%.
Never fake it. The FTC’s rule banning fake reviews, including AI-generated ones, took effect in October 2024, and it lets the FTC “seek civil penalties against knowing violators” (FTC). In December 2025, the agency sent warning letters to 10 companies about possible violations.
Small Business Marketing Statistics
The Federal Reserve Banks’ 2026 survey of small employer firms found that “reaching customers and growing sales was the most commonly reported operational challenge.” The same survey found that 46% of firms use AI, and among those, 83% use it for writing or marketing (Federal Reserve).
The Census Bureau tells a different story. As of May 2026, 19.8% of US businesses used AI to produce goods or services. That ranged from 37% of firms with 250 or more employees to less than 20% of firms with four or fewer (US Census Bureau).
Both can be true. Census asks about AI used to produce goods or services, while the Fed asks about any use, including writing emails and posts. Our guide to digital marketing for small business covers how to use it without losing your voice, and our small business statistics roundup has the broader picture.
E-Commerce and Other Channel Statistics
- E-commerce: US online retail sales were $340.2 billion in the second quarter of 2026, up 12.2% from a year earlier and 1% of all retail sales (US Census Bureau).
- Holiday shopping: US consumers spent $257.8 billion online in the 2025 holiday season, up 6.8%, according to Adobe. Traffic to retail sites from AI tools rose 693% (Adobe).
- Billboards and outdoor ads: US out-of-home ad spending grew 3.6% to $9.46 billion in 2025, with digital billboards making up 36% of sales (OAAA).
Google Ads and Facebook Ads Benchmarks
WordStream’s 2026 benchmarks, based on US campaigns, give a rough sense of ad costs. Both reports use medians and come from a vendor:
Platform | Cost per click | Cost per lead |
| Google search ads | $5.42 | $66.69 |
| Facebook lead campaigns | $1.80 | $27.39 |
| Facebook traffic campaigns | $0.60 | Not applicable |
Sources: WordStream Google Ads and WordStream Facebook Ads. For prices on 10 ad types, see our guide on how much advertising costs.
Marketing Statistics You Should Stop Repeating
Some marketing statistics get copied from blog to blog without anyone checking the source:
- “Email returns $36 (or $42) for every $1.” Litmus’s 2018 release said 38 to 1, based on about 400 marketers’ own estimates. It’s not a 2026 fact.
- “88% of consumers trust online reviews as much as personal recommendations.” That’s an old BrightLocal number. Its 2026 survey puts it at 49%.
- “People have an eight-second attention span, shorter than a goldfish.” There’s no credible study behind it.
- “93% of online experiences begin with a search engine.” We couldn’t find a primary source for this.
If a statistic has no date, no sample, and no link to the original research, don’t build a strategy on it.
What These Marketing Statistics Mean for Your Business
Social is where the money is going. If you’ve ignored it, test one platform your customers use daily.
Your reviews are your new homepage. With 97% of consumers reading them, recent, honest reviews may matter more than your ads.
Fewer clicks means your profile matters more. Make sure your Google Business Profile, website, and listings give complete, accurate answers.
Automate the emails that work. A few automated emails can outperform a busy newsletter calendar.
Frequently Asked Questions
How much is spent on digital advertising in the US?
US internet advertising revenue was $294.6 billion in 2025, up 13.9% from 2024, according to the IAB and PwC. The IAB expects US ad spending to grow about 12.3% in 2026.
What percentage of revenue do companies spend on marketing?
Gartner’s 2026 survey found marketing budgets averaged 7.8% of revenue, and The CMO Survey found 9.0% for US companies. Both mostly reflect larger companies, so small businesses should set budgets based on what they can test and afford.
Which social media platform is most used in the US?
YouTube, used by 84% of US adults in 2025, followed by Facebook at 71%, according to Pew Research Center.
Do AI summaries reduce website clicks?
In Pew’s 2025 study, Google users clicked a traditional result in 8% of visits when an AI summary appeared, compared with 15% when it didn’t.
How many consumers read online reviews?
BrightLocal’s 2026 survey found that 97% of US consumers read reviews for local businesses, and 41% always do.
Where do these marketing statistics come from?
They come from government sources like the Census Bureau, Federal Reserve, and FTC; research groups like Pew Research Center and The CMO Survey; industry associations like the IAB and OAAA; and vendors like Gartner, WordStream, Klaviyo, Adobe, and BrightLocal. We note vendor data where it appears.
The Bottom Line
The headline from the latest marketing statistics is the one we started with: social media passed search as the biggest category of US online advertising. But for a small business, the lesson isn’t “move everything to social.” It’s that customers now discover you in more places than ever, from feeds to AI answers to review sites, and the businesses that show up honestly and consistently in those places will win.