Quick answer: A currency pairs shows the price of one currency in terms of another, such as EUR/USD at 1.1154, meaning 1 euro costs about $1.12. Pairs fall into three groups: majors, which include the U.S. dollar and trade the most; minors, or crosses; and exotics. EUR/USD is the most traded pair in the world.
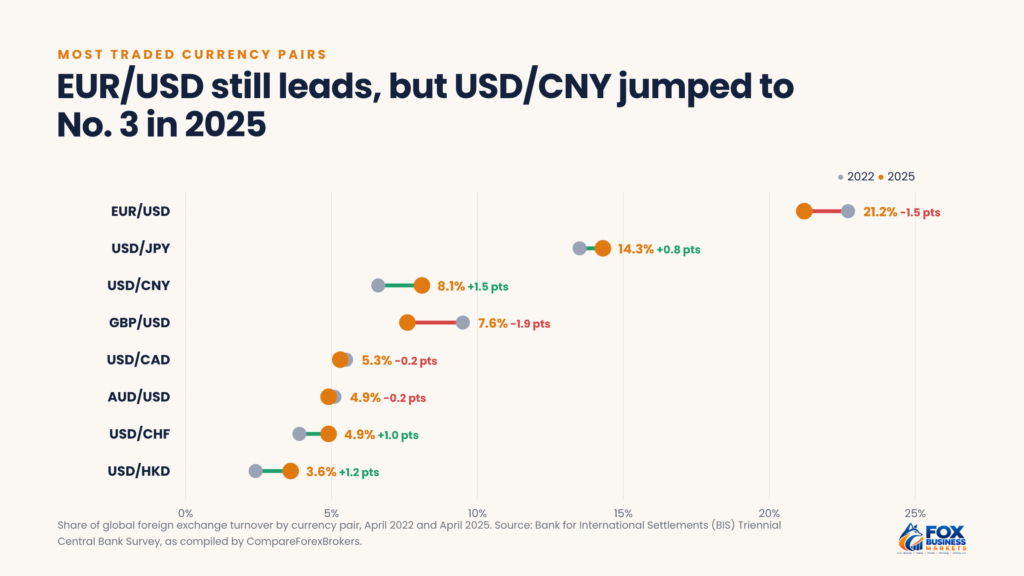
About $2 trillion worth of euros and dollars changes hands every day. EUR/USD made up 21.2% of all foreign exchange trading in April 2025, according to the Bank for International Settlements (BIS), which put total daily turnover at $9.6 trillion.
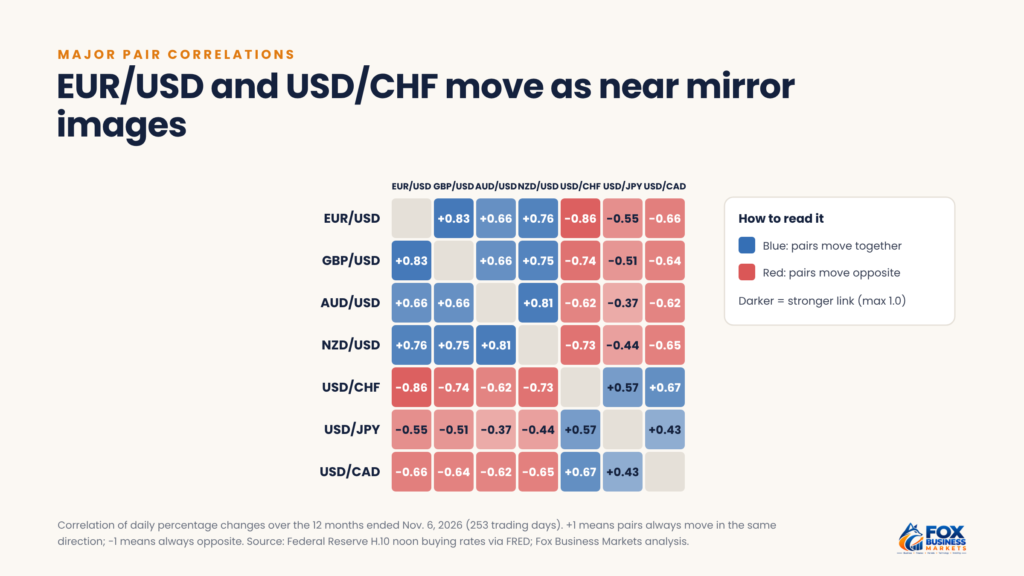
The most traded pair isn’t the most volatile, though, and pairs that look different often move as one. Over the 12 months through Nov. 6, 2026, EUR/USD and USD/CHF moved strongly in opposite directions, with a correlation of -0.86, according to our analysis of Federal Reserve exchange-rate data. A trader who buys EUR/USD and sells USD/CHF could be making nearly the same bet twice.
This guide explains how to read a currency pair, the differences between major, minor, and exotic pairs, which pairs move the most, how pairs move together, what drives each major pair, and how to choose the right pairs for your trading.
What Is a Currency Pairs?
A currency pair is a quote that compares the value of two currencies. Forex trades always involve a pair, because you buy one currency and sell another at the same time.
Every pair has two parts:
- Base currency: the first currency. It always equals one unit.
- Quote currency: the second currency. The price tells you how much of it equals one unit of the base currency.
If USD/JPY trades at 158.23, 1 U.S. dollar buys 158.23 Japanese yen. If GBP/USD trades at 1.3371, 1 British pound costs $1.3371.
When you buy a pair, also called going long, you buy the base currency and sell the quote currency. You profit if the base currency rises. When you sell a pair, or go short, you profit if the base currency falls.
Market convention decides which currency comes first. The euro is almost always the base currency, followed in priority by the British pound, the Australian and New Zealand dollars, and then the U.S. dollar. That’s why traders quote EUR/USD and GBP/USD but USD/JPY and USD/CAD.
For a broader introduction to the market, see our guide to forex trading.
How Do You Read a Currency Pair Quote?
Dealers show two prices for every pair:
- Bid: the price at which the dealer will buy the base currency from you. You sell at the bid.
- Ask: the price at which the dealer will sell the base currency to you. You buy at the ask.
- Spread: the difference between the two, and the main built-in cost of each trade.
Say EUR/USD is quoted at 1.1153/1.1155. You’d buy at 1.1155 and could immediately sell at 1.1153, so the spread is 2 pips. A pip is 0.0001 for most pairs and 0.01 for pairs with the Japanese yen. On a standard lot of 100,000 euros, each pip on EUR/USD is worth $10, so a 2-pip spread costs $20 per round trip.
Spreads are usually narrowest on the most traded pairs and during the busiest hours, when London and New York are both open. They widen for less traded pairs, overnight, and around major news releases.
Travelers see the same quote format at currency exchange counters, but with much wider spreads. Our guide to foreign currency exchange explains those costs.
How Does the Pair You Choose Change Your Profit per Pip?
A pip isn’t worth the same amount in every pair. Pip value is always counted in the quote currency, so U.S. traders have to convert it to dollars when the quote currency isn’t the dollar.
For one standard lot of 100,000 units of the base currency:
Pair | Pip size | Pip value in quote currency | Approximate pip value in U.S. dollars |
| EUR/USD | 0.0001 | $10 | $10.00 |
| GBP/USD | 0.0001 | $10 | $10.00 |
| USD/JPY | 0.01 | 1,000 yen | $6.32 at 158.23 |
| USD/CAD | 0.0001 | 10 Canadian dollars | $7.09 at 1.4106 |
| USD/CHF | 0.0001 | 10 Swiss francs | $12.21 at 0.8192 |
Pip values in dollars use Nov. 6, 2026, exchange rates and change as rates move.
To convert, divide the pip value in the quote currency by the current exchange rate when the dollar is the base currency. So a 50-pip move in USD/JPY on one standard lot is worth about $316, while the same 50-pip move in EUR/USD is worth $500.
Margin requirements also vary by pair. In the U.S., the Commodity Futures Trading Commission (CFTC) caps retail leverage at 50:1 for major currencies, which means a deposit of at least 2% of the position’s value, and 20:1, or 5%, for others. For one standard lot of EUR/USD at 1.1154, the position is worth about $111,540, so the minimum deposit would be about $2,231. The National Futures Association (NFA) has raised requirements for some currencies after sharp moves, such as the Swiss franc in 2015, so check your dealer’s margin table for each pair.
These differences matter less once you size trades by risk instead of lots. Decide how many dollars you’re willing to lose, measure your stop-loss distance in pips, then divide the dollar amount by your stop distance multiplied by the pip value per lot. The result is the number of lots to trade, and it risks the same amount on any pair.
What Are the Major Currency Pairs?
The major pairs, or majors, pair the U.S. dollar with another heavily traded currency. They have the most trading, the tightest spreads, and the most available research.
Pair | Nickname | Share of global forex turnover, 2025 | Change since 2022 |
| EUR/USD | Fiber | 21.2% | -1.5 points |
| USD/JPY | None common | 14.3% | +0.8 points |
| GBP/USD | Cable | 7.6% | -1.9 points |
| USD/CAD | Loonie | 5.3% | -0.2 points |
| AUD/USD | Aussie | 4.9% | -0.2 points |
| USD/CHF | Swissie | 4.9% | +1.0 point |
| NZD/USD | Kiwi | Smaller share | Not reported |
Source: BIS Triennial Central Bank Survey 2025, as compiled by CompareForexBrokers.
GBP/USD is called “Cable” because exchange rates between London and New York were once sent by transatlantic telegraph cable.
Share of global forex turnover by currency pair in 2022 and 2025
The biggest shift in the latest survey came from Asia. USD/CNY, the dollar against the Chinese renminbi, rose to 8.1% of turnover from 6.6%, passing GBP/USD to become the third-most-traded pair, as The Full FX noted. It isn’t usually listed as a major, because China manages its exchange rate and limits access for outside traders.
What Are Minor Currency Pairs?
Minor pairs, also called crosses, pair two major currencies without the U.S. dollar. Common examples:
- Euro crosses: EUR/GBP, EUR/JPY, EUR/CHF, and EUR/AUD
- Yen crosses: GBP/JPY, AUD/JPY, and CAD/JPY
- Other crosses: GBP/CHF, AUD/NZD, and GBP/AUD
Many crosses are priced through the dollar behind the scenes. EUR/JPY, for example, is effectively EUR/USD multiplied by USD/JPY. That’s one reason many crosses have wider spreads than majors.
Crosses let you trade a direct view on two economies. If you expect the European Central Bank to raise rates while the Bank of England cuts, EUR/GBP isolates that view without taking a position on the dollar.
Yen crosses such as GBP/JPY are known for large swings. They’re also popular for carry trades, in which traders borrow in a low-interest currency to buy a higher-yielding one. Carry trades can unwind fast, as in August 2024, when a sudden yen rally caused sharp losses.
What Are Exotic Currency Pairs?
Exotic pairs combine a major currency with the currency of a smaller or emerging economy. Examples include USD/MXN (Mexican peso), USD/ZAR (South African rand), USD/TRY (Turkish lira), USD/SGD (Singapore dollar), and USD/HKD (Hong Kong dollar).
Exotics carry extra risks:
- Wider spreads: Lower trading volume means higher costs per trade.
- Larger moves: Political events and capital flight can move these currencies sharply.
- Higher margin:S. rules require bigger deposits for non-major currencies, and the NFA can raise them further for volatile ones.
- Large overnight costs or credits: Interest rate gaps can be large, which changes the financing charge on positions held overnight.
Some exotics are managed by their governments. Hong Kong has pegged its dollar to the U.S. dollar since 1983, and since 2005 has kept it within a band of 7.75 to 7.85. China lets the renminbi trade within 2% of a daily reference rate set by its central bank. Pegs can hold for decades, but when they break, prices can jump with little warning.
Which Currency Pairs Move the Most?
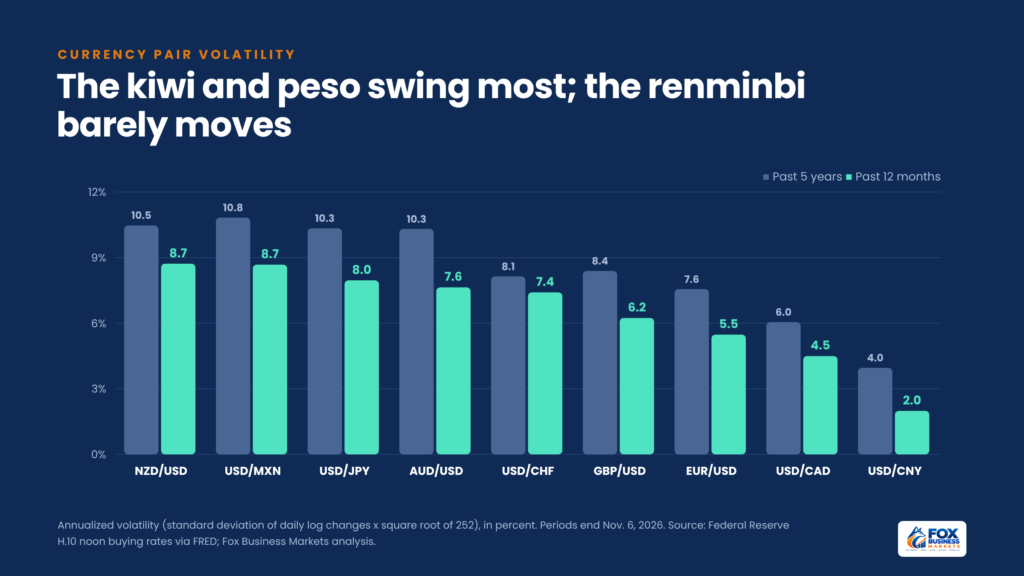
Volatility varies widely, even among the majors. Our analysis of daily Federal Reserve exchange rates measured how much each pair moved over the past year and the past five years.
Pair | Volatility, past 12 months | Volatility, past 5 years | Average daily move, past 12 months |
| NZD/USD | 8.7% | 10.5% | 24 pips |
| USD/MXN | 8.7% | 10.8% | N/A |
| USD/JPY | 8.0% | 10.3% | 53 pips |
| AUD/USD | 7.6% | 10.3% | 26 pips |
| USD/CHF | 7.4% | 8.1% | 28 pips |
| GBP/USD | 6.2% | 8.4% | 39 pips |
| EUR/USD | 5.5% | 7.6% | 30 pips |
| USD/CAD | 4.5% | 6.0% | 31 pips |
| USD/CNY | 2.0% | 4.0% | N/A |
Annualized standard deviation of daily changes. Daily moves compare noon New York rates from one day to the next, so intraday ranges are larger. Periods end Nov. 6, 2026. Source: Federal Reserve H.10 data via FRED; Fox Business Markets analysis.
Annualized volatility of major currency pairs over 12 months and five years
Three patterns stand out:
- Currency moves are smaller than stock moves. Most majors had volatility of 5% to 9% over the past year. The S&P 500’s long-run volatility is typically higher, often 15% to 20%. That’s one reason forex dealers offer high leverage, which brings the risk back up.
- Volatility has calmed. Every pair in our sample moved less over the past 12 months than over the past five years, which included the sharp dollar rally of 2022.
- Pips and percentages tell different stories. USD/JPY moved about 53 pips a day, but a yen pip is 0.01, so that equals roughly 0.3% of its price. Compare pairs by percentage volatility, not pips.
How Are Currency Pairs Correlated?
Because the U.S. dollar sits in every major pair, most majors move together. A broad dollar rally pushes EUR/USD, GBP/USD, and AUD/USD down while lifting USD/CHF, USD/JPY, and USD/CAD.
Correlation runs from +1, when two pairs always move in the same direction, to -1, when they always move in opposite directions. Over the 12 months through Nov. 6, 2026, daily changes showed:
- EUR/USD and USD/CHF: -0.86. The euro and Swiss franc tend to move together against the dollar, so these two pairs are close to mirror images.
- EUR/USD and GBP/USD: +0.83. Buying both is largely the same trade.
- AUD/USD and NZD/USD: +0.81. The two neighboring economies share trade links and commodity exposure.
- USD/JPY and AUD/USD: -0.37. The yen often follows its own path, driven by Japanese interest rates and safe-haven demand.
Correlation of daily changes among major currency pairs, November 2025 to November 2026
Correlations change over time, especially during crises and around central bank decisions. Recheck them every few months rather than relying on old numbers.
What Drives Each Major Pair?
Each major pair responds to its own set of economic forces:
- EUR/USD: The gap between Federal Reserve and European Central Bank interest rates, plus growth and inflation data from both economies. U.S. jobs reports often move it sharply.
- USD/JPY: The wide gap between U.S. and Japanese interest rates. Bank of Japan policy shifts can cause sudden swings. Japan’s Ministry of Finance bought yen in 2022 and 2024, and again in 2026, when it made record purchases in April and May and joined the U.S. in a rare joint intervention in late July after the yen fell to about 164 per dollar.
- GBP/USD: Bank of England decisions, U.K. inflation, and political news. The pound fell to a record low of about $1.035 in September 2022 after a U.K. budget shock.
- USD/CAD: Oil prices, because Canada is a major oil exporter, and the Bank of Canada’s rate decisions.
- AUD/USD and NZD/USD: Commodity prices and demand from China, Australia’s largest trading partner. Both are often treated as signals of global risk appetite.
- USD/CHF: Safe-haven demand. Investors buy francs during market stress, and the Swiss National Bank sometimes intervenes to limit the franc’s strength.
Scheduled economic releases cause many of the biggest daily moves. Our list of news events traders watch covers the key ones.
How Have the Major Pairs Performed in 2026?
The dollar has partly recovered from its steep 2025 decline. From Dec. 31, 2025, to Nov. 6, 2026:
Pair | Dec. 31, 2025 | Nov. 6, 2026 | 2026 change |
| EUR/USD | 1.1736 | 1.1154 | -5.0% |
| USD/CNY | 6.9931 | 6.6760 | -4.5% |
| NZD/USD | 0.5755 | 0.5549 | -3.6% |
| GBP/USD | 1.3447 | 1.3371 | -0.6% |
| USD/JPY | 156.80 | 158.23 | +0.9% |
| USD/CAD | 1.3712 | 1.4106 | +2.9% |
| AUD/USD | 0.6669 | 0.6875 | +3.1% |
| USD/CHF | 0.7936 | 0.8192 | +3.2% |
Federal Reserve noon buying rates in New York. Source: FRED.
The euro has fallen about 5% against the dollar this year, while the Australian dollar has gained about 3%. The renminbi has also strengthened against the dollar. A single “dollar trend” rarely tells the whole story, which is why traders track individual pairs.
Is It a Myth That Trading Several Pairs Spreads Your Risk?
Often, yes. Many traders assume that opening positions in four or five pairs spreads their risk. But if you buy EUR/USD, GBP/USD, and NZD/USD at the same time, you’ve placed three bets against the U.S. dollar. Based on the correlations above, a strong U.S. jobs report could push all three positions into losses at once.
Real diversification means holding positions that don’t depend on the same driver. Before you add a trade, check its correlation with what you already hold, and count your total exposure to each currency, not each pair. The same idea applies to a long-term investment portfolio, where owning many funds that track the same stocks adds little protection.
How Do You Choose a Currency Pair to Trade?
The right pair depends on your schedule, budget, and style. A few guidelines:
- Start with one or two majors. EUR/USD and USD/JPY offer heavy trading, tight spreads, and plenty of news coverage.
- Match the pair to your hours. Pairs move most when their home markets are open. EUR/USD and GBP/USD are most active during London hours, while AUD/USD and USD/JPY see more action in the Asian session.
- Compare costs. Check your broker’s typical spread and overnight financing charges for each pair.
- Size positions by volatility. A more volatile pair calls for a smaller position to keep the same risk.
- Avoid stacking correlated trades. Check how your pairs move together before opening new positions.
- Know the drivers. Follow the central banks and economic data behind the pairs you trade.
- Practice first. Test your approach on a demo account using a platform such as MetaTrader before you risk real money.
A consistent daily process helps too. Our guide to organizing a forex trading routine offers a framework, and our introduction to technical analysis price patterns covers chart basics that apply to currencies.
Frequently Asked Questions
Why do brokers quote different prices for the same pair?
Forex has no central exchange. Each dealer sets its own bid and ask based on prices from its liquidity providers, so quotes and spreads differ slightly from one broker to the next. Tip: Compare spreads during the hours you actually trade, not just the advertised minimum.
Why is the rollover charge larger on Wednesdays?
Spot forex trades settle two business days later. Positions held past the 5 p.m. Eastern close on Wednesday roll over the weekend, so they’re usually charged or credited for three days at once. Tip: Factor in triple rollover before holding a position through midweek.
How are profits on currency pairs taxed?
In the U.S., spot forex gains are generally taxed as ordinary income under Section 988 of the Internal Revenue Code. Traders can elect a different treatment in advance, which taxes gains under the rules for regulated futures contracts. Tip: Make any election before you trade, and confirm your situation with a tax professional.
Can you trade currency pairs in a regular brokerage account?
Not directly in most cases, since spot forex requires an account with a registered forex dealer. Many brokerages do offer currency exchange-traded funds (ETFs) and currency futures. Tip: Consider an unleveraged currency ETF if you want exposure to a currency without using leverage.
Learn One Pair Well Before You Trade Many
Currency pairs look simple, but each one reflects two economies, two central banks, and a web of links to other pairs. The majors offer the deepest markets and lowest costs, while exotics bring wider spreads and sharper swings.
Pick one or two pairs, learn what moves them, watch how they relate to each other, and keep your total exposure to any one currency in check. Leveraged trading can produce fast losses, so risk only money you can afford to lose.
This article is for general information only and isn’t financial, tax, legal, or investment advice. Consider your own situation or talk to a qualified professional before making decisions.

