


The latest startup statistics show a market that is booming at the top and tough everywhere else. Global venture funding hit $425 billion in 2025, and new unicorns in the first half of 2026 already outnumbered all of 2025. Yet about one in five new US businesses still closes in its first year, and most startups that fail simply run out of money.
We gathered the most useful startup statistics for 2026 in one place, from funding and AI to unicorns, founders, failure, and exits. Every number comes from a primary source such as Crunchbase, Carta, PitchBook, the Census Bureau, or the Bureau of Labor Statistics, with the date and a link.
Key Takeaways
- Global venture funding reached $425 billion in 2025, and $159 billion in Q3 2026 alone.
- AI startups took 64% of global venture funding in Q3 2026.
- 195 new unicorns were created in the first half of 2026, more than in all of 2025.
- Americans filed about 5.6 million applications to start a business in 2025.
- 70% of failed venture-backed startups ran out of capital, according to CB Insights.
- The share of new startups with a solo founder rose from 23.7% in 2019 to 36.3% in the first half of 2025.
How We Researched This
We collected startup statistics only from original data publishers: Crunchbase and PitchBook-NVCA for venture funding, Carta for startup rounds and founders, the Census Bureau and the Bureau of Labor Statistics for new businesses, the Kauffman Foundation for entrepreneurship rates, CB Insights for failure reasons, and Renaissance Capital for IPOs. Where a source covers only part of a year, we say so. We left out widely shared figures we couldn’t trace to an original source.
Startup Statistics at a Glance
| Statistic | Figure | Source |
| Global venture funding, 2025 | $425 billion | Crunchbase |
| Global venture funding, Q3 2026 | $159 billion | Crunchbase |
| AI share of global venture funding, Q3 2026 | 64% | Crunchbase |
| US venture deal value, Jan–Sep 2026 | $515.8 billion | PitchBook-NVCA |
| New unicorns, first half of 2026 | 195 | Crunchbase |
| Median seed round, 2026 | $4.1 million | Carta |
| Median time from seed to Series A | 1.9 years | Carta |
| US business applications, 2025 | About 5.6 million | Census Bureau |
| New business locations still open after 5 years | 51.4% | BLS |
| Failed startups that ran out of capital | 70% | CB Insights |
| New startups with a solo founder, H1 2025 | 36.3% | Carta |
| US IPOs, Q3 2026 | 30 | Renaissance Capital |
Below, we break down each of these startup statistics by topic, with the full context and a link to every source.
Startup Funding Statistics
- $425 billion was invested in startups worldwide in 2025, up 30% from $328 billion in 2024 (Crunchbase News).
- $274 billion of that went to US-based companies, about 64% of the global total.
- $159 billion was invested globally in Q3 2026, down 25% from $212 billion in Q2 but up 53% from $104 billion in Q3 2025 (Crunchbase News).
- $91 billion, or about 57% of Q3 2026 funding, went to US companies.
- 24% of global venture investment in Q3 2026 went to the San Francisco Bay Area alone.
- $515.8 billion in US venture deal value was recorded through the first three quarters of 2026 (PitchBook-NVCA).
Here’s how global Q3 2026 funding broke down by stage:
| Stage | Global funding, Q3 2026 | Change |
| Seed | $13 billion | Often revised up as rounds are reported |
| Early stage (Series A and B) | $40.6 billion | Up 25% from a year earlier |
| Late stage | $105 billion | Up 73% from a year earlier |
| Total | $159 billion | Up 53% from a year earlier |
Source: Crunchbase News, October 2026.
AI Startup Statistics
AI is the biggest story in startup funding:
- $211 billion went to AI startups worldwide in 2025, up 85% from $114 billion in 2024, roughly half of all venture funding (Crunchbase News).
- 64% of global venture funding, or $102 billion, went to AI startups in Q3 2026 (Crunchbase News).
- 7% of US venture deal value went to AI companies through Q3 2026, a record share (PitchBook-NVCA).
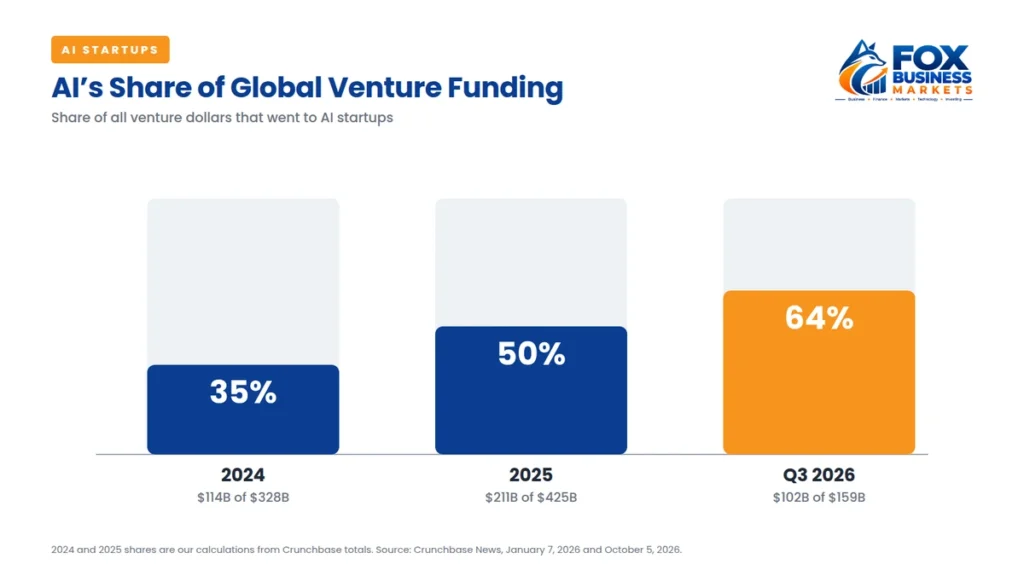
Much of this money is concentrated in a small number of very large AI rounds. For startups outside AI, raising money is often harder than the headline totals suggest.
Seed and Early-Stage Startup Statistics
These figures come from Carta, which tracks the cap tables of thousands of US startups:
- $4.1 million was the median seed round in 2026, at a $24.3 million median valuation (Carta).
- $14.4 million was the median Series A, at an $80 million
- 18% was the median share of the company founders sold at both seed and Series A.
- $3.19 billion was raised by US startups on Carta across more than 11,500 pre-seed instruments in Q2 2026, an average of $276,000 each (Carta).
- 9 years was the median time between a seed round and a Series A in Q4 2025 (Carta).
- 45% of US seed funding in 2025 went to Bay Area startups (Crunchbase News).
For a full breakdown of each round, see our guide to startup funding stages.
Unicorn Statistics
A unicorn is a private startup valued at $1 billion or more. 2026 is on pace to be a record year:
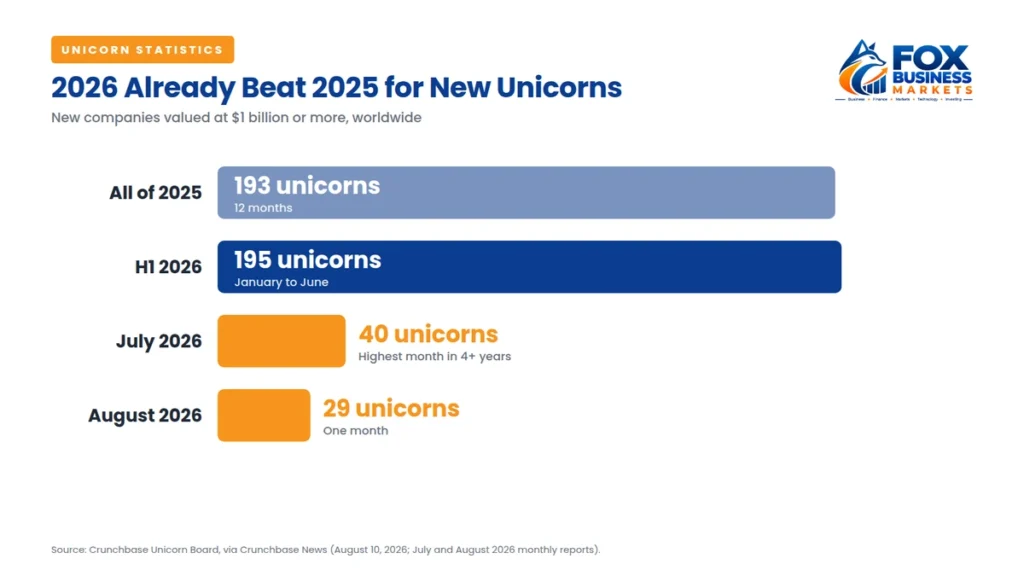
- 195 companies became unicorns in the first half of 2026, more than the 193 created in all of 2025 (Crunchbase News).
- 110 of those new unicorns, or 56%, were US companies.
- $440 billion in value was added to the Crunchbase Unicorn Board by those new unicorns.
- 40 companies joined the board in July 2026, the highest monthly total in more than four years (Crunchbase News).
- 29 more companies joined the board in August 2026 (Crunchbase News).
New Business Statistics
Not every new business is a high-growth startup, but these figures show how many people are starting companies:
- About 5.6 million applications to start a business were filed in the US in 2025 (Census Bureau via FRED).
- 531,728 business applications were filed in August 2026, seasonally adjusted (Census Bureau).
- 145,387 of August’s applications were “high-propensity,” meaning they’re more likely to become businesses with employees (FRED).
- 36% of adults became new entrepreneurs in an average month in 2025, or 360 out of every 100,000 (Kauffman Foundation).
- 3 jobs per 1,000 people were created by startups in 2025, according to Kauffman.
- 338,000 new business locations opened in Q4 2025, creating 1,006,000 jobs (BLS).
Startup Failure Statistics
Failure is common, and it usually follows a familiar pattern.
How many new businesses survive? The Bureau of Labor Statistics tracks every new business location in the US (BLS):
| Years after opening | Still open |
| 1 year | 77.9% |
| 2 years | 65.9% |
| 5 years | 51.4% |
| 10 years | 34.7% |
Why do venture-backed startups fail? In CB Insights’ March 2026 study of 431 venture-backed startups that shut down since 2023 (CB Insights):
- 70% ran out of capital
- 43% had poor product-market fit
- 29% cited bad timing or economic conditions
- 19% had unsustainable unit economics
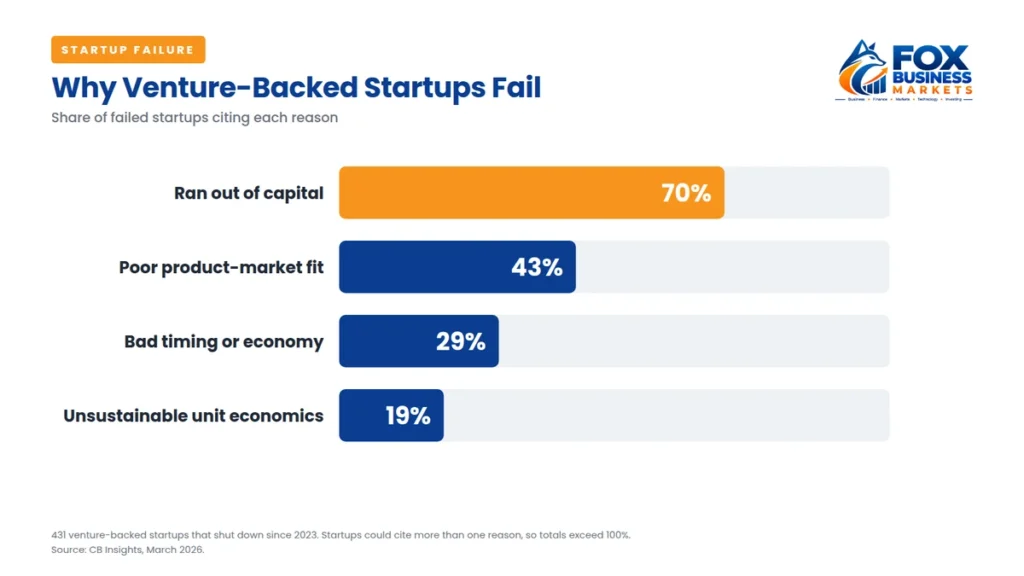
Startups could cite more than one reason, so the figures add up to more than 100%. CB Insights notes that running out of money is usually the final cause, not the root problem. Read more in our guide on why small businesses fail.
Startup Founder Statistics
- 3% of new startups had a solo founder in the first half of 2025, up from 23.7% in 2019 (Carta).
- Nearly one in five Y Combinator companies has a solo founder (Y Combinator).
- 7% of US venture deal value in 2025 went to companies with at least one female founder, a record $73.6 billion (PitchBook via Business Wire). Much of that came from a few very large AI rounds.
- 45 was the average founder age among the fastest-growing 0.1% of new US companies, according to a study using Census Bureau data (NBER). Successful founders are often older than the stereotype suggests.
Startup Exit and IPO Statistics
- 30 companies went public in the US in Q3 2026, raising $32.8 billion, according to Renaissance Capital (Renaissance Capital).
- 18 of the IPOs in Q3 2026 were venture-backed companies, most of them in healthcare (PitchBook-NVCA).
For most startups, being acquired is a far more common exit than an IPO.
What These Startup Statistics Mean for Founders
Taken together, these startup statistics point to a few clear lessons:
- Money is available, but concentrated. Record totals are driven by a few huge AI rounds. Most founders should expect a tougher, slower fundraise than the headlines suggest.
- The seed-to-Series A gap is long. With a median of about two years between rounds, plan your runway accordingly.
- Cash is what kills startups. Know your costs before you spend. Our startup cost calculator can help.
- You don’t need a co-founder or a perfect age. More than a third of new startups now start with one founder.
If you’re just getting started, read our step-by-step guide on how to start a startup.
Frequently Asked Questions
How much venture funding did startups raise in 2025?
Startups worldwide raised about $425 billion in venture funding in 2025, up 30% from 2024, according to Crunchbase. US companies raised about $274 billion of that.
What percentage of startups fail?
It depends on how you measure failure. Bureau of Labor Statistics data shows about 22% of new US business locations close within a year, about half within five years, and about 65% within 10 years.
What is the main reason startups fail?
Running out of money is the most common final cause. In CB Insights’ 2026 study, 70% of failed venture-backed startups ran out of capital, and 43% had poor product-market fit.
How many unicorns were created in 2026?
Crunchbase counted 195 new unicorns in the first half of 2026, more than the 193 created in all of 2025. The US accounted for 110 of them.
How much of venture funding goes to AI startups?
AI startups took 64% of global venture funding in Q3 2026, according to Crunchbase, and 82.7% of US venture deal value through Q3 2026, according to PitchBook-NVCA.
How many new businesses are started each year in the US?
Americans filed about 5.6 million applications to start a business in 2025, according to Census Bureau data.
Final Takeaway
The 2026 startup statistics tell two stories at once: record funding and record unicorn creation at the top, and the same hard odds for everyone else. Most startups still fail because they run out of money before they find enough customers. Use these numbers to set realistic expectations, plan your runway carefully, and raise money only when it moves your business forward.