Free Net Worth Calculator: Personal Balance Sheet & Wealth Tracker
While annual income measures your short-term earning power, your net worth is the ultimate objective metric of accumulated financial equity and long-term financial security. True wealth accumulation requires regularly converting transient cash inflows into durable, appreciating balance sheet assets while systematically retiring compound debt liabilities. This institutional calculator serves as your personal balance sheet auditor, aggregating cash reserves, retirement portfolios, real estate equity, and consumer obligations to calculate your true liquid and aggregate net worth in real time.
Who It's For:
Essential for private investors, corporate executives, entrepreneurs, and forward-thinking families tracking balance sheet expansion, assessing asset liquidity, and preparing for mortgage underwriting or retirement modeling.
Why Use It:
- Liquid vs. Illiquid Asset Segmentation: Instantly isolate deployable cash and publicly traded securities from fixed physical real estate to quantify true emergency liquidity.
- Solvency & Leverage Auditing: Automatically calculates your Debt-to-Asset ratio and solvency profile to protect against balance sheet distress.
- Multi-Currency Wealth Modeling: Evaluate assets and liabilities seamlessly across USD ($), GBP (£), EUR (€), CAD (C$), or AUD (A$) with instant mathematical recalculation.
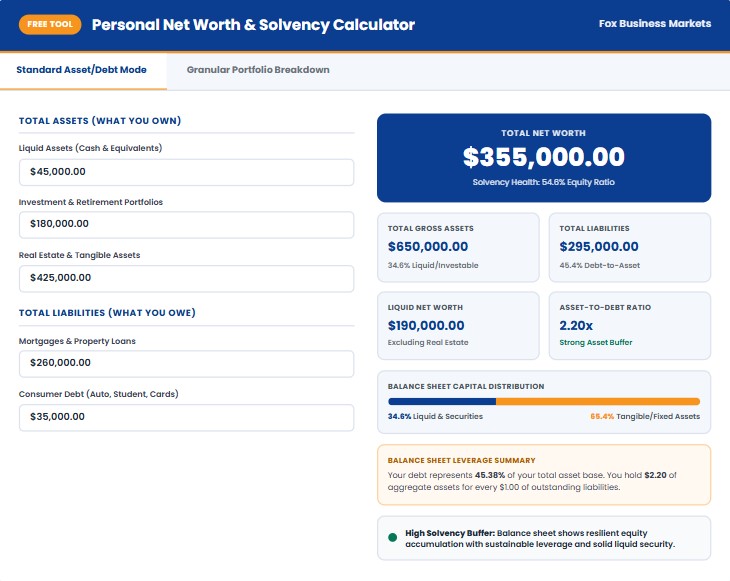
Your debt represents 45.38% of your total asset base. You hold $2.20 of aggregate assets for every $1.00 of outstanding liabilities.
High Solvency Buffer: Positive equity with manageable debt-to-asset metrics and resilient liquidity coverage.
1. How to Use the Personal Net Worth Calculator
Tracking your personal balance sheet provides an unvarnished audit of your financial trajectory. Unlike monthly budgeting tools that track transaction velocity, this calculator measures accumulated capital retained over time.
- Select Your Operating Currency: Choose between USD ($), GBP (£), EUR (€), CAD (C$), or AUD (A$) via the top-bar dropdown. All ledger entries and derived solvency multiples recompute instantly.
- Input Gross Asset Values:
- Standard Mode: Enter aggregated totals for Liquid Assets (checking, high-yield cash, money market), Investment Portfolios (taxable brokerage, 401k, IRAs), and Tangible/Fixed Assets (primary home market value, investment properties, vehicles).
- Granular Mode: Break out cash, speculative securities, retirement accounts, primary residential property, and physical equity into distinct line items.
- Catalog Outstanding Liabilities: Enter all debt obligations encumbering your balance sheet, dividing them between asset-backed obligations (first mortgages, home equity lines of credit) and unsecured consumer credit (auto financing, student debt, revolving cards).
- Analyze Balance Sheet Solvency: Review your headline Net Worth, your Liquid Net Worth (deployable capital excluding illiquid residential property), and your Debt-to-Asset leverage ratio to verify balance sheet health.
2. How It Works & Core Mathematical Formulas
This engine executes double-entry personal accounting logic grounded in corporate balance sheet principles, isolating equity, leverage, and liquidity coverage ratios.
Total Liabilities (L_total) = Mortgages & Real Estate Debt + Consumer & Revolving Debt
Total Net Worth (NW) = A_total - L_total
Liquid Net Worth (LNW) = (Liquid Reserves + Public Securities) - Consumer Unsecured Debt
Equity Ratio (%) = (Total Net Worth / A_total) * 100
Debt-to-Asset Leverage Ratio (%) = (L_total / A_total) * 100
Asset-to-Debt Solvency Multiple = A_total / L_total
These mathematical relationships reveal not just whether you have positive wealth, but whether your assets are resilient against liquidity shocks or interest rate shifts:
- Positive Solvency: An Asset-to-Debt multiple above 2.0x demonstrates that gross assets can decline by 50% before balance sheet liabilities breach parity.
- Liquid Net Worth Delta: If headline Net Worth is high but Liquid Net Worth is negative, an individual is "house-rich and cash-poor" — highly vulnerable to emergency cash demands.
3. Fully Worked Numerical Example
Consider an established mid-career professional auditing their household balance sheet prior to a corporate transition or real estate acquisition:
Balanced Household Capital Portfolio
- Cash & Liquid Cash Equivalents: $45,000.00
- Brokerage & Retirement Equities (401k/IRA): $180,000.00
- Residential Real Estate Market Value: $425,000.00
- Total Gross Balance Sheet Assets: $650,000.00
Outstanding Debt Obligations:
- Primary Mortgage Principal Balance: $260,000.00
- Consumer Liabilities (Auto Loan & Student Debt): $35,000.00
- Total Balance Sheet Liabilities: $295,000.00
Step-by-Step Mathematical Resolution:
- Total Net Worth: $650,000.00 - $295,000.00 = +$355,000.00.
- Solvency Equity Ratio: ($355,000.00 / $650,000.00) * 100 = 54.62% (Over half of all gross assets represent pure equity).
- Debt-to-Asset Leverage Ratio: ($295,000.00 / $650,000.00) * 100 = 45.38% (Sustainable long-term leverage profile).
- Asset-to-Debt Multiplier: $650,000.00 / $295,000.00 = 2.20x (The borrower holds $2.20 of collateral assets for every $1.00 of debt).
- Liquid Net Worth: ($45,000.00 + $180,000.00) - $35,000.00 = +$190,000.00 (Strong liquid cushion independent of home equity).
4. Calculator Interface & Balance Sheet Simulation
The interactive dashboard computes capital concentration, debt ratios, and solvency buffers instantly. Below is a rendered model of the household balance sheet evaluated in the worked example:
5. Age-Based Net Worth Benchmarks & Milestones
Empirical wealth accumulation models developed by institutional economists measure target net worth as a multiple of gross annual income based on working age. Below are standard institutional benchmarks:
| Age Bracket | Target Net Worth Multiple | Target Liquid Share (%) | Max Recommended D/A Ratio | Primary Strategic Balance Sheet Objective |
|---|---|---|---|---|
| Age 30 | 1.0x Gross Annual Income | 50% – 70% | 60% | Eliminate student debt; establish diversified index equity baseline. |
| Age 40 | 3.0x Gross Annual Income | 40% – 50% | 50% | Build significant home equity; scale compound retirement vehicles. |
| Age 50 | 6.0x Gross Annual Income | 40% – 60% | 35% | Aggressively amortize mortgage debt; maximize catch-up contributions. |
| Age 60 | 8.0x Gross Annual Income | 60% – 75% | 20% | De-risk equity allocations; eliminate all consumer and auto liabilities. |
| Retirement (65+) | 10.0x – 12.0x Annual Spend | 70% – 85% | < 10% | Maintain capital preservation; establish safe withdrawal cash ladders. |
6. Where to Find Your Numbers
Estimating asset values arbitrarily inflates balance sheet equity. Pull verified figures from authoritative source documents:
- Cash & Depository Balances: Check the cleared balances across your retail checking, commercial accounts, and high-yield savings portals.
- Marketable Securities: Reference closing statement values from taxable brokerage firms, mutual fund custodians, and retirement plan trustees (401k, Traditional/Roth IRA).
- Real Estate Valuations: Use recent tax assessment appraisals or conservative comparative market analyses (CMA). Deduct an estimated 6% to 8% to reflect real estate agent fees and closing transaction frictions if liquidated.
- Mortgage Balances: Download your latest principal amortization statement. Do not confuse the remaining loan payoff balance with the total remaining payments (which include unaccrued interest).
- Commercial & Enterprise Equity: If you hold private shares or operating business interests, evaluate equity using our Business Ownership Calculator and Enterprise Value Calculator.
- Corporate Debt Parity: For personal-guarantee commercial liabilities, review leverage structures via our Debt-to-Equity (D/E) Calculator.
7. What This Calculator Can and Cannot Tell You
What It Tells You
- Structural Equity Solvency: Verifies whether your accumulated asset base exceeds contractual indebtedness.
- Liquid Resilience: Isolates cash and marketable securities to prove whether you can withstand a 12-month earnings shock without liquidating real estate.
- Leverage Vulnerability: Identifies if high-interest revolving credit is offsetting investment gains.
What It Cannot Tell You
- Future Investment Returns: Does not predict annual market returns, dividend growth rates, or inflation drag.
- Tax Friction on Liquidation: Treats $100k in a Traditional 401(k) the same as $100k in a Roth account, omitting embedded tax liabilities upon withdrawal.
- Monthly Cash Flow Velocity: A high net worth does not prevent short-term overdrafts if assets are locked in illiquid holdings.
8. Related Personal & Corporate Balance Sheet Tools
Balance sheet management requires connecting operational cash flows with structural capital planning. Utilize these dedicated financial models:
Debt-to-Equity (D/E) Calculator
Analyze balance sheet gearing, capital structure, and leverage multiples.
Working Capital Calculator
Model short-term operating liquidity, current assets, and immediate liabilities.
Business Loan Calculator
Calculate loan amortization schedules, interest expense, and debt service coverage.
Growth Rate (CAGR) Calculator
Compute compound annual growth rates across your portfolio and investment holdings.
9. Frequently Asked Questions (FAQ)
Should I include my primary residence in my personal net worth?
Yes, for aggregate net worth accounting, your home is an asset offset by its outstanding mortgage principal. However, institutional wealth managers distinguish between Total Net Worth and Investable/Liquid Net Worth. Because residential real estate generates maintenance, insurance, and tax costs rather than immediate liquid cash, you should not rely on home equity to cover ongoing retirement expenses.
How should I value personal vehicles and household goods?
Conservatively. Vehicles are rapidly depreciating physical assets, not wealth-generating capital. Value vehicles strictly at conservative trade-in wholesale value (e.g., Kelley Blue Book wholesale) rather than retail replacement cost. Do not include consumer furniture, electronics, or personal clothing on a serious balance sheet unless they are verified, insured collectibles with documented secondary market liquidity.
What constitutes an alarming Debt-to-Asset ratio?
A Debt-to-Asset ratio above 70% indicates elevated financial vulnerability, meaning a minor 15% to 20% correction in asset values (such as a local housing slump or equity market drawdown) could wipe out your equity or trigger negative net worth. Healthy prime-borrower portfolios maintain a Debt-to-Asset ratio below 40%, dropping toward zero as retirement approaches.
Why does pre-tax retirement money distort net worth calculations?
A Traditional 401(k) or IRA contains an embedded deferred tax liability owed to the federal and state government upon withdrawal. For example, a $500,000 Traditional 401(k) held by an individual in a 25% effective tax bracket represents $375,000 in spendable capital. When conducting estate planning or retirement simulations, apply a 20% to 25% haircut to pre-tax retirement accounts to reflect true after-tax equity.
How does a founder's net worth align with early-stage business planning?
Commercial lenders and angel investors frequently scrutinize the personal balance sheet of early-stage founders to verify personal financial runway before committing institutional capital. Demonstrating sufficient personal solvency ensures you can withstand early operational delays without drawing premature emergency dividends, a requirement covered in our guide on how to write a business plan.
10. The Bottom Line & Authoritative References
Your net worth is the ultimate scorecard of capital efficiency. High income without balance sheet accumulation simply funds a lifestyle treadmill, whereas deliberate debt reduction, liquid capital compounding, and prudent asset diversification create permanent financial freedom. Re-evaluate your personal balance sheet quarterly to track trajectory, eliminate consumer debt leakage, and protect your capital against macroeconomic volatility.
Authoritative Industry References:
- Federal Reserve Board (FRB): Survey of Consumer Finances (SCF) — the definitive triennial benchmark tracking median and mean family net worth across US demographic brackets.
- Internal Revenue Service (IRS): Estate and Gift Tax Valuation Guidelines — regulatory frameworks governing fair market valuation of physical assets, real estate, and private corporate equity.
- Financial Planning Association (FPA): Balance Sheet Management Guidelines — professional wealth management standards regarding liquid vs. illiquid asset allocation ratios.
- Securities and Exchange Commission (SEC): Accredited Investor Wealth Standards — official criteria defining accredited investor solvency thresholds ($1,000,000 net worth excluding primary residence).