In 2025, Mexico did something it hadn’t done the year before: it passed Canada as the top buyer of U.S. goods. Mexico was already the largest supplier of U.S. imports, so it became America’s No. 1 trading partner on both sides of the ledger. Meanwhile, imports from China fell about 30% in a single year as tariffs reshaped how American businesses buy from abroad. In 2026, a Supreme Court ruling and the tariff refunds that followed added another twist.
These US trade statistics show a year of big shifts. Here’s the short version: the U.S. goods and services trade deficit was $932.0 billion in 2025, about 5% larger than in 2024, but it narrowed 19.9% in the first eight months of 2026 as exports grew faster than imports. Mexico, Canada, and China remain the top partners, while trade with China has fallen sharply.
All US trade statistics below come from the Census Bureau, the Bureau of Economic Analysis (BEA), and the Treasury Department, with dates noted. Goods figures are on a Census basis unless stated otherwise.
What Is the US Trade Deficit in 2026?
The U.S. ran a goods and services trade deficit of $931.96 billion in 2025, up from $885.47 billion in 2024, according to revised annual figures from the Census Bureau and BEA (June 2026). A trade deficit means the country imported more than it exported. The U.S. ran a deficit of $1.26 trillion in goods and a surplus of $327.7 billion in services.
The picture improved in 2026. For January through August, the goods and services deficit fell $138.2 billion, or 19.9%, from the same period of 2025, according to the BEA’s October 6, 2026 release. Exports rose 11.8% while imports rose 4.4%. Monthly numbers still swing: the August 2026 deficit was $105.6 billion, up from $92.8 billion in July.
Measure | 2024 | 2025 | Change |
| Goods and services deficit (balance of payments basis) | $885.5 billion | $932.0 billion | +5.3% |
| Goods deficit (balance of payments basis) | $1,212.8 billion | $1,259.6 billion | +3.9% |
| Services surplus | $327.3 billion | $327.7 billion | +0.1% |
| Total exports, goods and services | $3,236.4 billion | $3,429.8 billion | +6.0% |
| Total imports, goods and services | $4,121.9 billion | $4,361.8 billion | +5.8% |
Source: Census Bureau and BEA, annual revision released June 9, 2026.
How Much Does the US Import and Export?
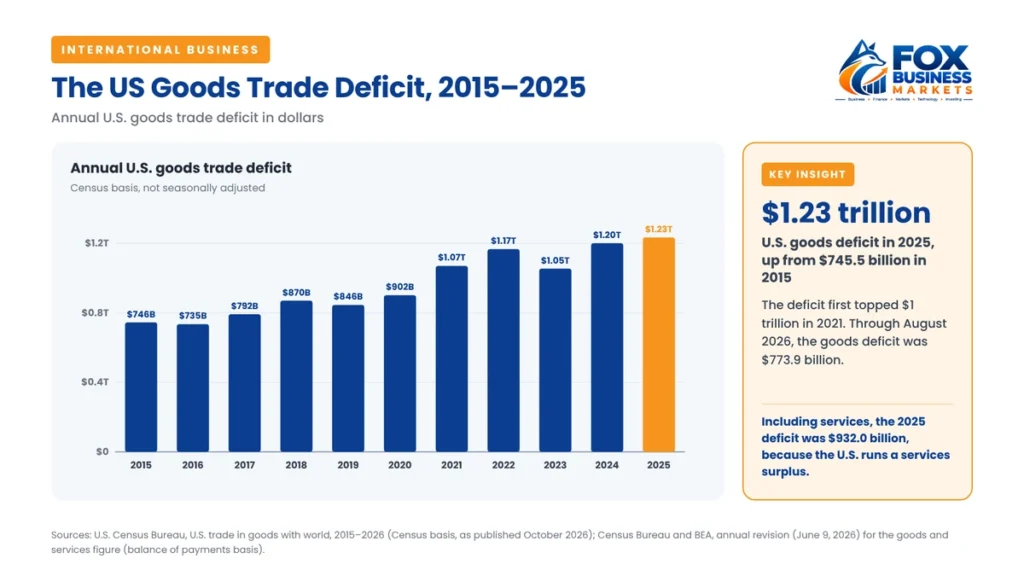
The U.S. imported $3.41 trillion in goods and exported $2.18 trillion in 2025 on a Census basis, both all-time highs in nominal terms in Census data. Goods imports rose 4.6% from 2024, while goods exports rose 5.7%. Over the past decade, the goods deficit has grown from $745.5 billion in 2015 to $1.23 trillion in 2025.
How has the goods trade deficit changed over the past decade?
The goods deficit has grown in most years since 2015. On a Census basis, it rose from $745.5 billion in 2015 to $870.4 billion in 2018, crossed $1 trillion for the first time in 2021 ($1.07 trillion), dipped in 2023 to $1.05 trillion, and reached $1.23 trillion in 2025. Through August 2026, the goods deficit stood at $773.9 billion. Year-to-year changes in these US trade statistics often reflect the economy as much as trade policy: imports rise when American consumers and businesses are spending.
What about services?
Services tell a different story. The U.S. exported $1.24 trillion in services in 2025, things like travel, finance, software licensing, and education, and it consistently runs a surplus in services. That’s one reason the overall deficit is smaller than the goods deficit alone.
For context on how this flows down to online sellers, our ecommerce statistics cover the retail side.
Who Are the Top US Trading Partners?
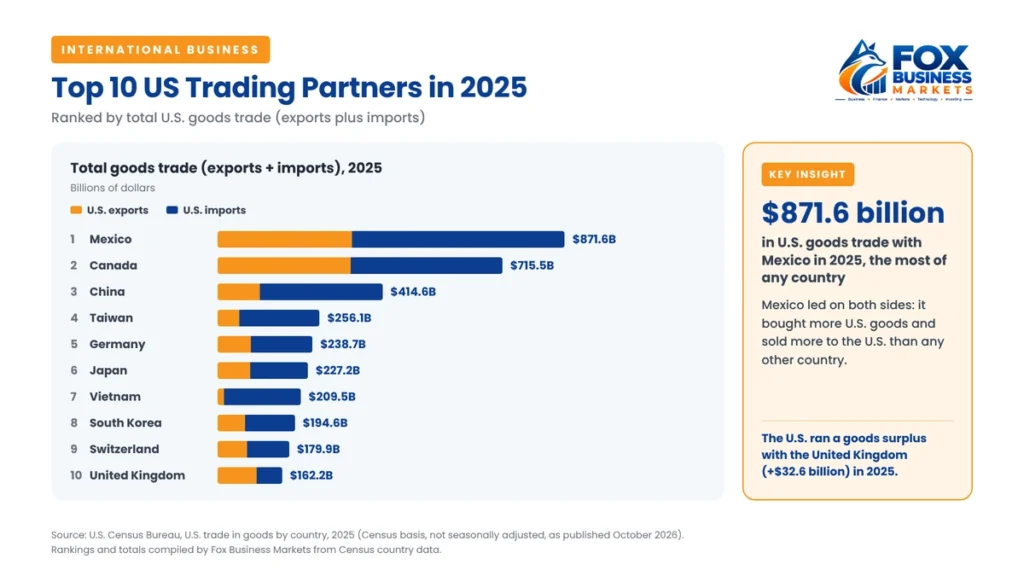
According to the latest US trade statistics, Mexico was the top U.S. trading partner in 2025, with $871.6 billion in total goods trade (exports plus imports), about 15.6% of the U.S. total. Canada ranked second at $715.5 billion and China third at $414.6 billion, according to Census country data.
Rank | Country | Total trade, 2025 | U.S. exports | U.S. imports | U.S. balance |
| 1 | Mexico | $871.6B | $337.3B | $534.3B | −$197.0B |
| 2 | Canada | $715.5B | $333.6B | $381.9B | −$48.3B |
| 3 | China | $414.6B | $106.0B | $308.7B | −$202.7B |
| 4 | Taiwan | $256.1B | $54.8B | $201.4B | −$146.6B |
| 5 | Germany | $238.7B | $82.8B | $155.8B | −$73.0B |
| 6 | Japan | $227.2B | $81.4B | $145.8B | −$64.4B |
| 7 | Vietnam | $209.5B | $15.6B | $193.9B | −$178.3B |
| 8 | South Korea | $194.6B | $69.1B | $125.5B | −$56.5B |
| 9 | Switzerland | $179.9B | $73.7B | $106.2B | −$32.5B |
| 10 | United Kingdom | $162.2B | $97.4B | $64.8B | +$32.6B |
Source: Census Bureau, U.S. trade in goods by country (as published October 2026); rankings and totals compiled by Fox Business Markets.
What happened to trade with Canada?
Canada stayed the second-largest partner, but trade shrank in 2025. U.S. exports to Canada fell 4.8% to $333.6 billion, and imports from Canada fell 7.3% to $381.9 billion, according to Census data. Tensions rose again in 2026: Canada imposed counter-tariffs of 15% to 50% on about C$27.6 billion of U.S. goods starting September 8, 2026, so expect those US trade statistics to keep moving.
Which countries have the biggest trade deficits with the US?
China had the largest U.S. goods deficit in 2025 at $202.7 billion, followed closely by Mexico ($197.0 billion) and Vietnam ($178.3 billion). The U.S. ran surpluses with some partners, including the Netherlands ($59.0 billion) and the United Kingdom ($32.6 billion).
How Has Trade With China Changed?
U.S. trade with China has fallen sharply. Imports from China dropped from $538.5 billion in 2018 to $308.7 billion in 2025, a decline of about 43%, according to Census data. The goods deficit with China shrank from $418.2 billion to $202.7 billion over the same period, roughly half.
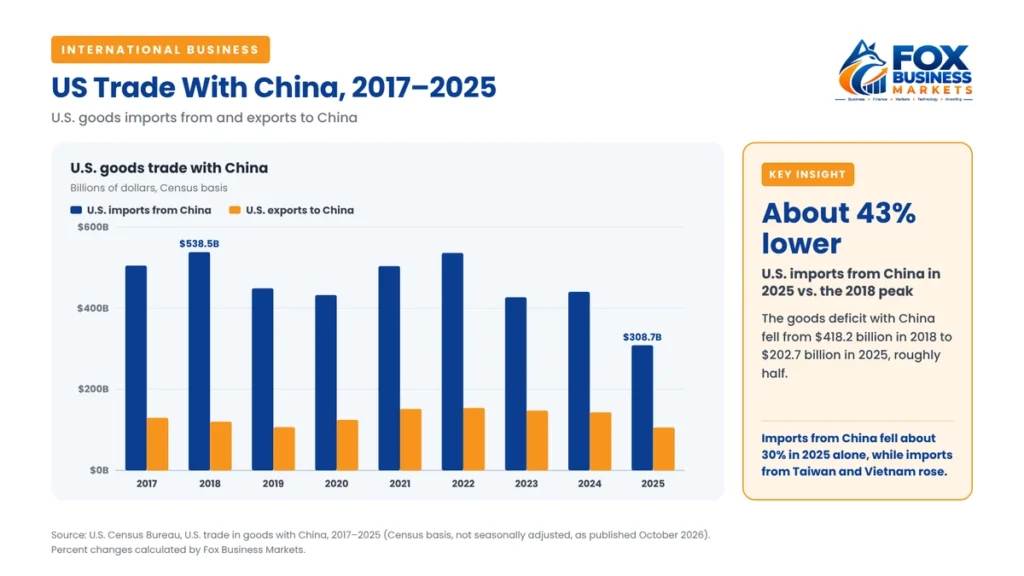
The biggest one-year drop came in 2025, when imports from China fell about 30% from $440.3 billion in 2024. U.S. exports to China also fell, by about 26%, to $106.0 billion. The trend continued into 2026: China supplied about 7.6% of U.S. goods imports from January through August, behind Mexico, Canada, and Taiwan.
Much of that trade didn’t disappear; it moved. Imports from Taiwan rose about 73% in 2025, and imports from Vietnam rose about 42%. If you buy from overseas suppliers, our guide on how to import products covers what changes when you switch countries.
How Much Do Tariffs Bring In?
Customs duties brought in $194.9 billion in net receipts in fiscal 2025, according to the Treasury’s Monthly Treasury Statement, up from $77.0 billion in fiscal 2024. Monthly net receipts hit a record $31.4 billion in October 2025, the first month of fiscal 2026.
Fiscal 2026 looks very different on paper. Net customs receipts were $173.2 billion after $144.6 billion in refunds, most of them paid from May onward, following the Supreme Court’s February 2026 ruling that the International Emergency Economic Powers Act (IEEPA) doesn’t authorize tariffs. Our explainer on what tariffs are covers that ruling and the tariffs still in effect.
Fiscal year (Oct.–Sept.) | Gross customs receipts | Refunds | Net customs receipts |
| 2025 | $202.4 billion | $7.5 billion | $194.9 billion |
| 2026 | $317.8 billion | $144.6 billion | $173.2 billion |
Source: U.S. Treasury, Monthly Treasury Statement, Table 4.
What Do Trade Statistics Mean for Small Businesses?
Small and midsize firms make up almost all U.S. traders, even if large companies move most of the dollars. In 2024, 97.3% of identified U.S. importers and 97.1% of exporters had fewer than 500 employees, according to the Census Bureau’s latest company profile (May 2026). Small and midsize exporters shipped about $581 billion, roughly 32% of known export value.
Most exporters stay focused, too: 60% of all U.S. exporters sold to only one country in 2024. If you’re considering selling abroad, our guide on how to start an export business walks through the steps, and our small business statistics put these numbers in context.
Trade Statistics Myths to Stop Repeating
A few popular claims don’t hold up against the US trade statistics.
“Tariffs shrank the trade deficit in 2025.” They didn’t, at least not on an annual basis. The goods and services deficit grew from $885.5 billion in 2024 to $932.0 billion in 2025, and the Census-basis goods deficit grew from $1.20 trillion to $1.23 trillion. The deficit did narrow in the first eight months of 2026, mostly because exports grew faster than imports.
“China is still America’s biggest supplier.” Not since 2023. In 2025, the U.S. imported more from both Mexico ($534.3 billion) and Canada ($381.9 billion) than from China ($308.7 billion), and through August 2026, Taiwan had narrowly passed China year to date ($186.9 billion vs. $183.5 billion), though China led in each month from June to August.
“The US runs a deficit with everyone.” It runs surpluses with several partners, including the Netherlands and the United Kingdom, and an overall surplus in services.
Frequently Asked Questions
What is the US trade deficit in 2026?
From January through August 2026, the U.S. goods and services trade deficit was 19.9% smaller than in the same period of 2025, according to the BEA. The monthly deficit was $105.6 billion in August 2026. For the full year 2025, the deficit was $932.0 billion.
Who is the largest US trading partner?
Mexico was the largest U.S. trading partner in goods in 2025, with $871.6 billion in total trade. It was both the biggest buyer of U.S. goods ($337.3 billion) and the biggest supplier ($534.3 billion). Canada ranked second and China third, based on Census Bureau data.
How much does the US import from China?
The U.S. imported $308.7 billion in goods from China in 2025, down about 30% from $440.3 billion in 2024 and about 43% below the 2018 peak of $538.5 billion. From January through August 2026, China supplied about 7.6% of U.S. goods imports, according to Census data.
Does the US have a trade surplus with any country?
Yes. In 2025, the U.S. ran goods trade surpluses with several partners, including the Netherlands ($59.0 billion) and the United Kingdom ($32.6 billion), according to Census data. The U.S. also ran an overall services trade surplus of $327.7 billion in 2025.
How much money do tariffs raise?
Net customs duties were $194.9 billion in fiscal 2025, according to the Treasury Department. In fiscal 2026, net receipts were $173.2 billion after $144.6 billion in refunds, most paid from May onward after the Supreme Court’s February 2026 ruling striking down tariffs imposed under the IEEPA.
When is new US trade data released?
The Census Bureau and BEA publish US trade statistics monthly, roughly five weeks after the month ends. The next release, covering September 2026, is scheduled for November 4, 2026. Census also publishes annual revisions each June that can change earlier figures.
The Bottom Line
These US trade statistics tell a story of rerouting more than retreat. Mexico became the center of U.S. trade, China’s share kept falling, and Taiwan and Vietnam picked up much of the slack. The overall deficit grew in 2025 but narrowed in 2026 as exports rose.
For a small business, the practical takeaway is that supplier countries, tariffs, and refunds can change within a single year. Recheck your sourcing costs at least annually, and if your customers are abroad, keep an eye on what other countries charge on U.S. goods. We’ll update these figures as new data come out.

