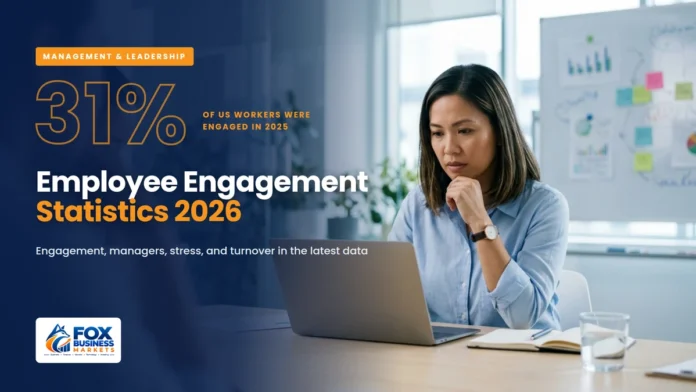
In 2020, 36% of US employees were engaged at work, the highest level Gallup had recorded. By 2025, that figure had fallen to 31%. It sounds like a small drop until you do the math: each point represents about 1.6 million workers, so roughly 8 million fewer Americans feel involved in and enthusiastic about their jobs than five years ago (Gallup).
The latest employee engagement statistics point to a clear pattern. The drop isn’t spread evenly, managers are struggling more than the people they lead, and half the workforce is keeping an eye on the exit. Here’s what the 2025 and 2026 data shows, and what it means if you run a team.
Key Numbers at a Glance
Here are the most important employee engagement statistics for 2026, with their sources:
Statistic | Figure | Source |
| US employees engaged at work (2025) | 31% | Gallup |
| US employees actively disengaged (2025) | 17% | Gallup |
| Employees engaged worldwide (2025) | 20% | Gallup |
| Managers engaged worldwide (2025) | 22%, down from 31% in 2022 | Gallup |
| Managers who have ever had management training | 44% | Gallup |
| Share of team engagement variance driven by the manager | 70% | Gallup |
| US employees looking for or watching for a new job | 51% | Gallup |
| Global cost of low engagement | About $10 trillion, or 9% of GDP | Gallup |
| US quits rate (August 2026) | 1.9% | BLS |
| Median time with current employer (January 2026) | 4.1 years | BLS |
US Employee Engagement in 2025
Gallup surveyed nearly 79,000 US workers in 2025. Engagement “averaged 31% in 2025, unchanged from 2024,” and 17% were actively disengaged, meaning they were unhappy and likely to spread that unhappiness to others (Gallup).
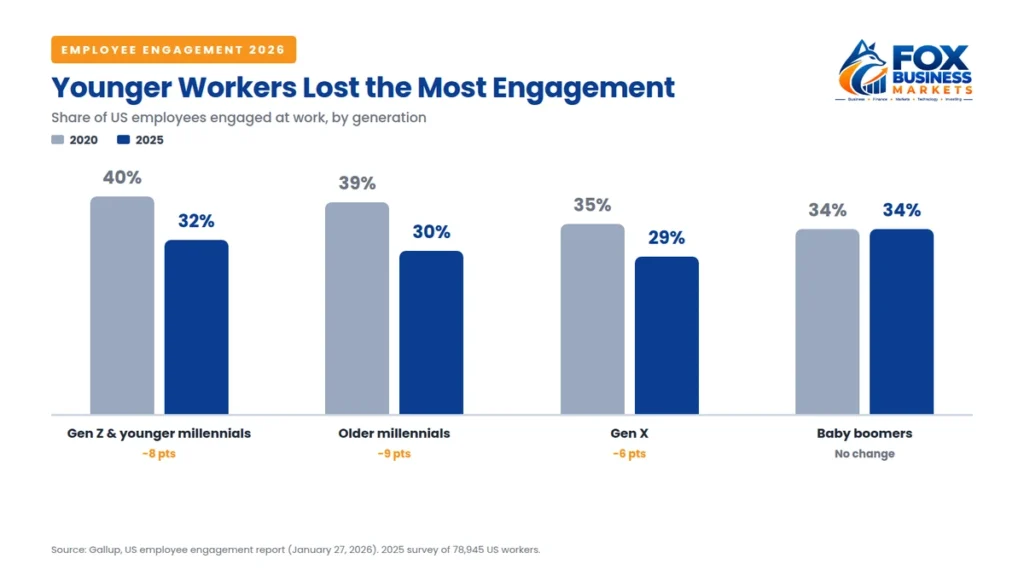
The decline since 2020 has hit younger workers hardest:
Generation | Engaged in 2020 | Engaged in 2025 |
| Gen Z and younger millennials | 40% | 32% |
| Older millennials | 39% | 30% |
| Gen X | 35% | 29% |
| Baby boomers | 34% | 34% |
Behind those numbers are some basic breakdowns. The share of employees who strongly agree “I know what is expected of me at work” fell 9 points from 2020, the biggest drop of any engagement question. Among Gen Z and younger millennials, it went from 51% to 42%. The share who feel their supervisor or someone at work “seems to care about me as a person” fell 8 points overall, and among the youngest workers it fell from 54% to 41%.
Read together, these employee engagement statistics say something simple: many younger employees aren’t sure what’s expected of them and don’t feel anyone at work is paying attention.
Engagement by Role: Clarity Makes the Difference
One of the most useful employee engagement statistics from 2025 is about clarity. Gallup asked workers in different roles whether they had clear expectations for what exceptional performance looks like. Few did, but those who did were far more engaged (Gallup):
| Role | Strongly agree they have clear expectations | Engaged if they agree | Engaged if they don’t |
| Leaders | 32% | 81% | 28% |
| People managers | 22% | 71% | 19% |
| Project managers | 22% | 63% | 19% |
| Individual contributors | 22% | 66% | 18% |
In every role, clear expectations roughly tripled the odds of being engaged.
Global Engagement and Its Cost
Global employee engagement statistics look even worse. Gallup’s State of the Global Workplace 2026 report found that just 20% of employees were engaged in 2025, down from 21% the year before. Gallup estimates that low engagement costs the global economy “approximately $10 trillion in lost productivity, or 9% of GDP” (Gallup).
The US and Canada region, at 31% engaged, remains well above the global average. But a higher number doesn’t mean a healthy one. Roughly seven in 10 US workers are still not engaged.
Management Statistics: Managers Are Struggling Too
Among all the management statistics in this report, one stands out. Managers matter more than any other factor in engagement. Gallup’s research finds that “managers account for 70% of the variance in team engagement” (Gallup). And managers themselves are in trouble.
Global manager engagement has fallen four years in a row:
- 2022: 31%
- 2023: 30%
- 2024: 27%
- 2025: 22%
The drop from 2024 to 2025 was “the largest year-over-year drop in manager engagement” in Gallup’s data (Gallup). Managers also report more stress than the people they lead: 45% said they felt stress “a lot of the day,” compared with 39% of individual contributors (Gallup).
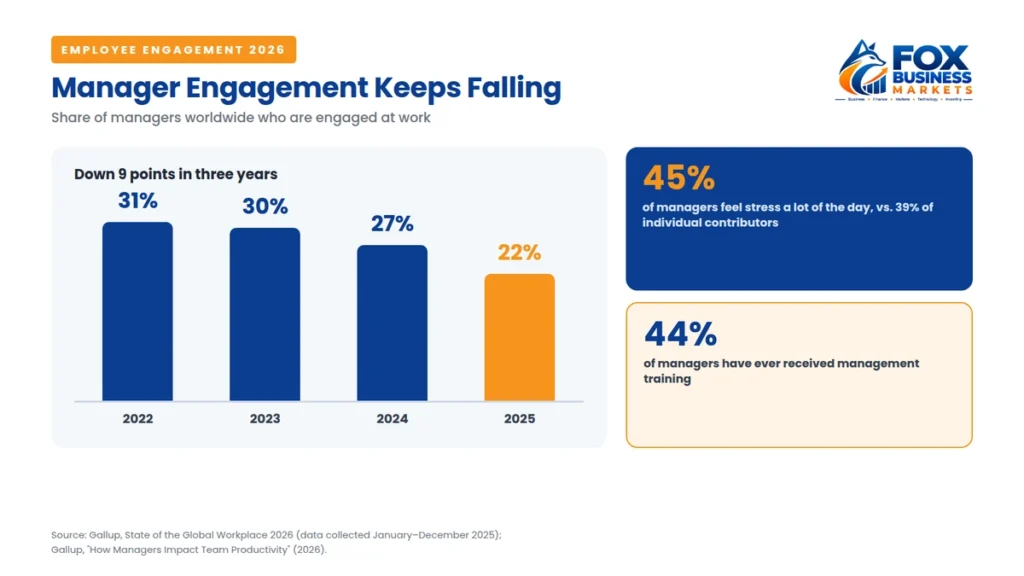
Part of the problem is preparation. Only 44% of managers worldwide have ever received management training.
Employers are noticing. In SHRM’s 2026 research, 46% of chief human resources officers named leadership and manager development a top priority for the year, ranking it first for the second year in a row (SHRM).
For context on the size of this group, the Bureau of Labor Statistics counted 11.1 million people in management occupations in May 2025, with a mean annual wage of $145,260 (BLS).
Stress, Wellbeing, and Loneliness
Stress is common everywhere. Globally, 40% of employees said they experienced stress “a lot of the previous day,” and 22% reported loneliness (Gallup).
In the US, wellbeing is slipping. In Gallup’s late-2025 survey, 46% of US workers were “thriving” in their overall lives, down from 53.4% in early 2022, while 49% were struggling (Gallup).
Feedback, Recognition, and Pay
Some of the strongest employee engagement statistics involve habits that cost little. Gallup found that “80% of employees who say they have received meaningful feedback in the past week are fully engaged.” Yet only 16% said their last conversation with their manager was extremely meaningful. Recognition shows a similar gap: only 23% of employees strongly agree they get the right amount of recognition, and just 10% have ever been asked how they like to be recognized (Gallup).
Pay matters, but it’s rarely the whole story. Gallup’s research on why people leave found that “pay/benefits” was the most common single reason, but it came up only 16% of the time. Broader issues of engagement and culture (37%) and wellbeing and work-life balance (31%) were the leading themes (Gallup). Meanwhile, private-sector wages and salaries rose 3.1% in the year ending June 2026 (BLS).
Turnover and Job Hunting
Engagement problems show up in job-seeking behavior. In Gallup’s fourth-quarter 2025 survey, 51% of US employees were either actively looking for a new job (11%) or watching for opportunities (40%). But only 28% said it was a good time to find a quality job (Gallup).
That gap helps explain why actual quitting is low. The Bureau of Labor Statistics reported 3.1 million quits in August 2026, a quits rate of 1.9%, with 7.1 million job openings (BLS). Many unhappy workers are staying put for now. That’s a risk, not a comfort: when the job market improves, they’re ready to leave.
People are also staying longer. Median time with a current employer rose to 4.1 years in January 2026, up from 3.9 years in 2024. In management occupations, it was 6.1 years (BLS).
Remote, Hybrid, and AI at Work
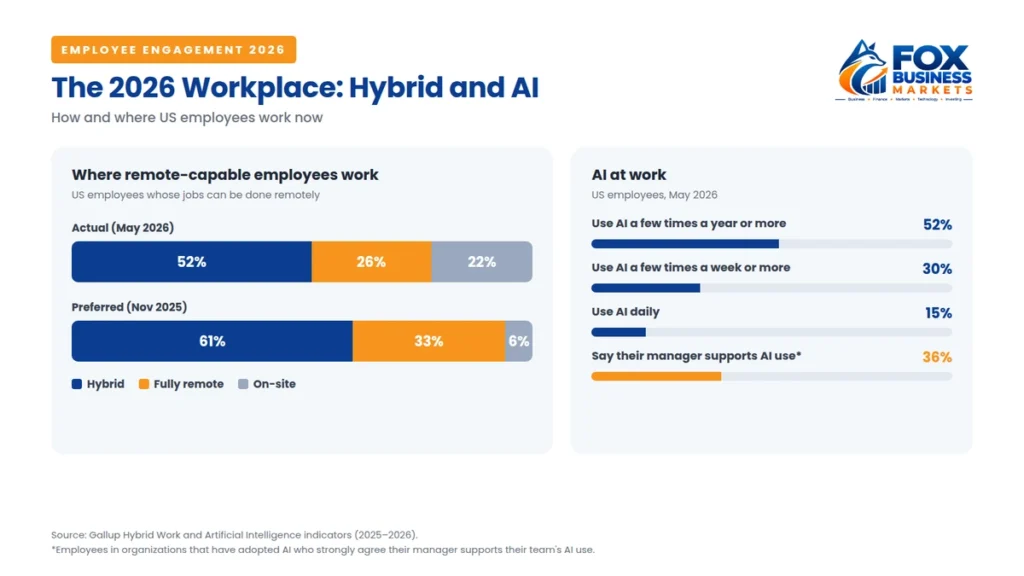
Among US employees whose jobs can be done remotely, 52% worked hybrid schedules as of May 2026, 26% worked fully remote, and 22% worked fully on-site (Gallup). Preferences lean even more toward flexibility: in late 2025, only 6% of remote-capable workers said they’d prefer to be fully on-site.
AI is spreading quickly. As of May 2026, 52% of US employees used AI at work at least a few times a year, 30% used it frequently, and 15% used it daily. But in organizations that have adopted AI, only 36% of employees strongly agreed that their manager supports their team’s use of it (Gallup).
What These Employee Engagement Statistics Mean for Managers
Strip away the percentages and four lessons stand out.
Clarity is the cheapest fix. The biggest single drop in engagement was in people knowing what’s expected of them. Clear goals, explained regularly, cost nothing.
Managers need support before they can give it. With manager engagement at a record low and fewer than half ever trained, organizations can’t expect managers to lift their teams alone. Our guide on how to be a good manager covers the habits that matter most.
Younger workers need more attention, not less. The steepest declines are among Gen Z and younger millennials, especially in feeling cared about and having room to grow. Our guide on how to motivate employees explains what research says actually works.
Quiet doesn’t mean loyal. With half of US employees watching for new jobs, today’s low quit rate may not last. How you lead now, explained in our guide to leadership styles, will decide who stays when it does.
Frequently Asked Questions
What percentage of employees are engaged at work in 2026?
The latest full-year data shows 31% of US employees were engaged in 2025, unchanged from 2024. Worldwide, 20% of employees were engaged.
Why is employee engagement declining?
Gallup’s data shows the biggest declines in employees knowing what is expected of them and feeling that someone at work cares about them, especially among younger workers. Falling manager engagement is also a major factor.
How much does low employee engagement cost?
Gallup estimates low engagement costs the global economy about $10 trillion in lost productivity, or 9% of global GDP.
How engaged are managers?
Only 22% of managers worldwide were engaged in 2025, down from 31% in 2022. Managers also report more daily stress than individual contributors.
What percentage of employees are looking for a new job?
In late 2025, 51% of US employees were actively looking for a new job or watching for opportunities, according to Gallup.
How many employees work remotely?
Among US employees with remote-capable jobs, 52% work hybrid schedules, 26% work fully remote, and 22% work fully on-site, according to Gallup’s May 2026 data.
Where do these employee engagement statistics come from?
Most figures come from Gallup’s ongoing workplace research, including its annual US engagement survey of nearly 79,000 workers and its State of the Global Workplace 2026 report. Job, wage, and tenure data come from the US Bureau of Labor Statistics.
The Bottom Line
The newest employee engagement statistics aren’t a story about lazy workers. They’re a story about unclear expectations, stretched managers, and employees waiting for a better option. The fix starts with the person closest to the work: a manager who makes expectations clear, pays attention, and gets the support they need to lead.