1. How to Use the Deposit Growth Calculator
The Deposit Growth Calculator models the long-term future value of depository cash reserves under dynamic recurring contributions, scheduled annual contribution increases (step-ups), and inflation discounting. Follow this four-step sequence:
- Select Display Mode & Operating Currency: Choose between the Standard Growth Projections tab (for nominal terminal balances) and the Inflation-Adjusted Purchasing Power tab (to discount future dollars against inflation). Set your currency (USD, EUR, GBP, CAD, or AUD) using the header dropdown.
- Enter Core Capital Allocations: Input your opening Initial Seed Deposit followed by your planned Recurring Monthly Deposit amount.
- Configure Growth Drivers & Step-Up: Set the nominal annual interest rate (or APY) alongside your anticipated Annual Step-Up (%) to model scheduled increases in your monthly savings as income expands.
- Designate Horizon, Inflation & Compounding: Define your total accumulation timeframe in years, your assumed Consumer Price Index (CPI) inflation rate, and your depository compounding frequency (Daily, Monthly, Quarterly, or Annually). The model computes your terminal wealth, real purchasing power, and capital breakdown in real time.
2. How It Works & Core Mathematical Formulas
Standard future value models assume fixed periodic payments. However, real-world wealth accumulation reflects progressive savings step-ups and compounding over multi-year cycles.
Step-Up Annuity Accumulation Mechanics
For each year $y$ from $1$ to $T$, the active monthly contribution $PMT_y$ escalates according to the annual step-up rate ($g$):
Where:
• PMT_1 = Baseline first-year monthly contribution
• g = Annual contribution step-up percentage (e.g., 3.0% = 0.03)
• y = Current calendar year of the projection timeline
Monthly Compounded Balance Iteration
With an effective monthly interest rate $i = (1 + r / n)^(n / 12) - 1$, the portfolio terminal value updates iteratively across every monthly sub-interval:
Where:
• FV_0 = Initial Seed Principal (P)
• r = Nominal annual interest rate
• n = Annual compounding frequency (e.g., 12 for monthly, 365 for daily)
Real Inflation-Adjusted Purchasing Power
To quantify the purchasing capacity of nominal dollars at year $T$, the future value is discounted by the projected annual inflation rate ($inf$):
3. Fully Worked Numerical Example
Corporate Treasury Liquidity Accumulation: 10-Year Simulation
An enterprise treasury team establishes an automated cash accumulation fund under the following parameters:
- Initial Seed Deposit ($P$): $10,000
- Starting Monthly Contribution ($PMT_1$): $750
- Nominal Annual Rate ($r$): 5.50% (Monthly Compounding, $n = 12$)
- Annual Contribution Step-Up ($g$): 3.0% per annum
- Time Horizon ($T$): 10 Years (120 Months)
- Assumed Inflation Rate: 2.50% CPI per year
Step 1: Escalate Periodic Contributions Over 10 Years
Year 1 Monthly: $750.00 | Annual Deposits: $9,000.00
Year 2 Monthly: $750 × (1.03)^1 = $772.50 | Annual: $9,270.00
Year 5 Monthly: $750 × (1.03)^4 = $844.13 | Annual: $10,129.56
Year 10 Monthly: $750 × (1.03)^9 = $978.58 | Annual: $11,742.96
Total Cumulative Monthly Deposits = $103,165.00
Total Out-of-Pocket Invested = $10,000 + $103,165 = $113,165.00
Step 2: Calculate Compounded Terminal Valuation ($FV$)
Monthly Rate i = 0.055 / 12 = 0.0045833
Terminal Balance at Month 120 = $157,488.22 (≈ $157,488)
Total Compound Interest Earned = $157,488.22 - $113,165.00 = $44,323.22 (28.1% of terminal wealth)
Step 3: Compute Real Inflation-Adjusted Purchasing Power
Discount Factor = (1 + 0.025)^10 = (1.025)^10 = 1.280085
Real Purchasing Power = $157,488.22 / 1.280085 = $123,029.50 (≈ $123,030)
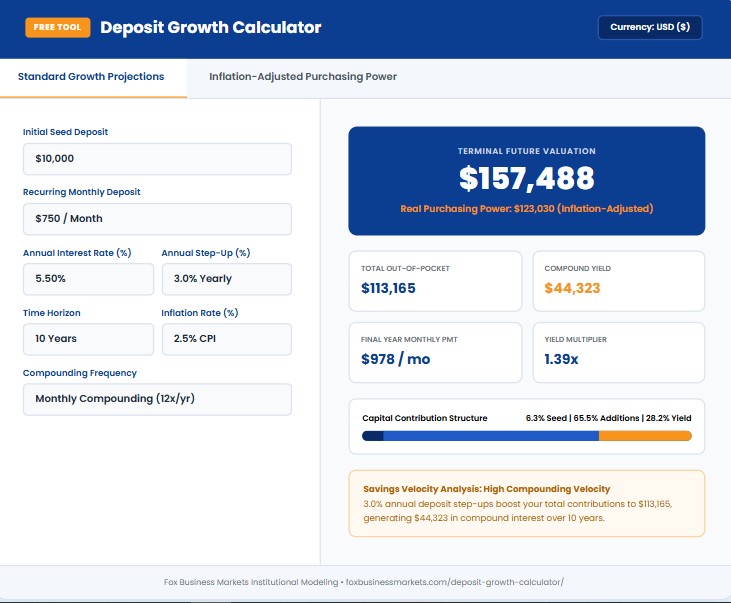
Takeaway: Disciplined 3% annual contribution step-ups generate a final balance of $157,488, of which $44,323 represents pure compound yield, preserving real purchasing power well above inflation at $123,030.
4. Calculator Interface & Wealth Projection Overview
5. Step-Up Savings Velocity Comparison Over 10 Years
The table below demonstrates the compounding advantage of implementing annual contribution step-ups versus static flat savings on a $10,000 seed deposit with $750 starting monthly contributions at 5.50% interest:
| Annual Step-Up Strategy | Final Year Monthly Deposit | Total Principal Invested | Total Interest Accrued | Terminal Portfolio Value | Real Value (2.5% CPI) |
|---|---|---|---|---|---|
| 0.0% (Static Monthly Savings) | $750.00 / mo | $100,000.00 | $38,873.00 | $138,873.00 | $108,487.00 |
| 2.0% Annual Step-Up | $896.32 / mo | $108,542.00 | $42,450.00 | $150,992.00 | $117,954.00 |
| 3.0% Annual Step-Up | $978.58 / mo | $113,165.00 | $44,323.00 | $157,488.00 | $123,030.00 |
| 5.0% Annual Step-Up | $1,163.49 / mo | $123,365.00 | $48,348.00 | $171,713.00 | $134,142.00 |
| 7.0% Annual Step-Up | $1,378.85 / mo | $135,124.00 | $52,948.00 | $188,072.00 | $146,921.00 |
6. Where to Find Your Numbers
To ground your deposit growth projections in verified financial operational figures, draw variables from official sources:
- Seed Deposit Balance ($P$): Identify available liquid balances on your corporate balance sheet. Check liquidity cushions via our Working Capital Calculator to avoid depleting immediate operational reserves.
- Recurring Monthly Capacity: Base monthly savings allocations on net free cash flow after operating overhead. Evaluate monthly cash outflows using the Burn Rate Calculator.
- Annual Deposit Step-Up Rate ($g$): Align contribution increases with projected corporate revenue growth or historical wage increases via our Salary Increase Calculator.
- Depository Return Rates ($r$): Check stated deposit yields against effective annual returns using our dedicated APY Calculator.
7. What This Calculator Can and Cannot Tell You
What It Can Tell You
- The precise terminal value generated by annual contribution escalations over static deposit schedules.
- Inflation-adjusted purchasing power to ensure savings strategies outpace cost-of-living increases.
- The exact capital split between initial seed capital, cumulative monthly contributions, and compound yield.
- The nominal wealth multiplier achieved across customized multi-year horizons.
What It Cannot Tell You
- Tax Drag Deductions: Does not deduct annual income taxes on accrued interest reported via Form 1099-INT.
- Variable Interest Volatility: Assumes interest rates remain stable over the entire multi-year timeframe.
- Early Withdrawal Penalties: CD forfeitures or account break fees are not automatically subtracted.
- Irregular Outflows: Does not simulate unscheduled mid-term emergency capital withdrawals.
8. Related Business & Financial Calculators
Explore complementary wealth planning and credit calculators from Fox Business Markets:
Compound Interest Calculator
Model core compound interest growth across customizable lump-sum and recurring deposit profiles.
APY Calculator
Uncover real Annual Percentage Yield across diverse intra-year compounding frequencies.
Salary Increase Calculator
Calculate merit raises and cost-of-living adjustments to project annual deposit step-up capacity.
APR Calculator
Compare deposit yield returns directly against the true cost of credit and borrowing facilities.
9. Frequently Asked Questions (FAQ)
What is an annual step-up contribution, and why is it important?
An annual step-up contribution is an automated percentage increase applied to your monthly savings deposit at the start of each year. By scaling contributions alongside salary increases or corporate revenue growth, step-ups significantly shorten the time needed to reach financial milestones compared to flat savings schedules.
Why is inflation adjustment critical when projecting savings?
Inflation steadily erodes purchasing power over time. A nominal balance of $150,000 ten years from now will not purchase the same volume of goods and services as $150,000 today. Factoring in inflation isolates your "real" purchasing power so you can target true economic goals.
Does compounding frequency significantly affect long-term deposit growth?
Yes, though it exhibits diminishing marginal returns. Moving from annual to monthly compounding provides a meaningful boost in effective yield. Moving from monthly to daily compounding adds a modest incremental gain, converging toward continuous compounding limits.
Should emergency reserve funds be modeled using step-up contributions?
Typically, emergency reserve funds are scaled until they reach 3 to 6 months of operating expenses, as evaluated via our Burn Rate Calculator. Once this buffer is established, step-up savings should be redirected toward growth portfolios or high-yield instruments.
How do taxes affect the figures displayed by this calculator?
In taxable accounts, interest earned is generally taxed annually as ordinary income, which slows the compounding velocity. To achieve the exact growth figures displayed here, investors frequently utilize tax-advantaged accounts or tax-deferred corporate treasury vehicles.
10. The Bottom Line & Authoritative References
Disciplined periodic savings combined with annual contribution step-ups form the foundation of sound long-term capital accumulation. By pairing recurring cash infusions with regular compounding and accounting for real purchasing power, treasury managers and savers build durable balance sheets capable of weathering market cycles and inflation pressures.
Authoritative References & Academic Reading:
- Federal Reserve Bank of St. Louis (FRED): Historical macroeconomic data on M2 money supply, personal savings rates, and Consumer Price Index (CPI) trends.
- Consumer Financial Protection Bureau (CFPB): Guidance on building emergency savings, high-yield depository products, and personal financial management standards.
- Federal Deposit Insurance Corporation (FDIC): National savings account rate benchmarks, deposit insurance rules, and truth-in-savings regulatory guidelines.
- Bodie, Zvi, Kane, Alex, & Marcus, Alan J. (Investments): Core academic literature on nominal versus real returns, inflation risk, and dynamic wealth accumulation modeling.