1. How to Use the Compound Interest Calculator
Our interactive Compound Interest Calculator evaluates exponential capital accumulation under periodic contributions and diverse reinvestment intervals. Follow this four-step sequence to model your target investment trajectory:
- Select Your Operating Currency: Choose USD ($), EUR (€), GBP (£), CAD (C$), or AUD (A$) from the header selector. All monetary fields and chart scales will calibrate instantly.
- Input Capital Allocations: Enter your Initial Principal balance. Select between the With Regular Deposits tab (to simulate routine monthly contributions) and the Lump Sum Only tab (for one-off investments).
- Set Return Parameters & Time Horizon: Enter your anticipated nominal annual rate of return (%) alongside your projected investment timeframe in years.
- Designate Compounding Frequency: Specify how frequently earnings are recapitalized (Daily, Monthly, Quarterly, Semi-Annually, or Annually). The calculator updates future terminal balances, total interest accrued, and capital ratios in real time.
2. How It Works & Core Mathematical Formulas
Compound interest differs fundamentally from simple linear interest because accrued yields are continuously added back into the principal base. In subsequent periods, interest is generated not only on original deposits but also on accumulated yields.
Terminal Value of Initial Principal
For a singular lump-sum investment, the future value ($FV_P$) is computed using the standard compounding equation:
Where:
• P = Initial Principal investment
• r = Nominal annual interest rate (in decimal format: 8% = 0.08)
• n = Compounding frequency per annum (e.g., 12 for monthly, 365 for daily)
• t = Total duration of the investment in years
Future Value of Recurring Periodic Additions (Annuity Stream)
When periodic recurring payments ($PMT$) are contributed at the close of every compounding sub-interval, an annuity compound factor is applied to determine incremental growth:
Where:
• i = Effective periodic rate per monthly contribution cycle = (1 + r / n)^(n / 12) - 1
• N = Total number of monthly contributions = 12 × t
• Total Portfolio Value (FV) = FV_P + FV_A
Annual Percentage Yield (APY) Equivalence
To evaluate the true economic yield generated by intra-year compounding relative to the quoted nominal rate ($r$), the institutional Annual Percentage Yield formula is applied:
3. Fully Worked Numerical Example
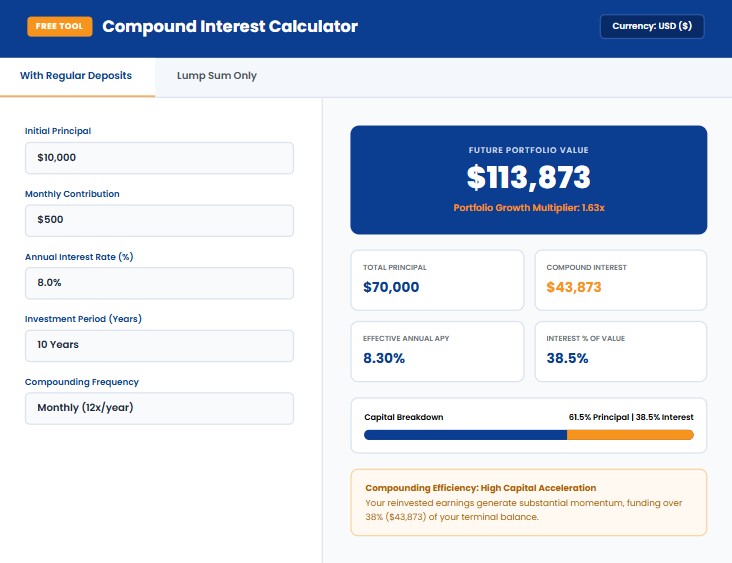
Portfolio Growth Modeling: 10-Year Horizon Analysis
Consider an enterprise treasury manager or retail investor allocating capital under the following parameters:
- Initial Principal ($P$): $10,000
- Monthly Contribution ($PMT$): $500
- Nominal Annual Rate ($r$): 8.00% (0.08)
- Investment Duration ($t$): 10 Years
- Compounding Frequency ($n$): Monthly ($n = 12$)
Step 1: Compute Terminal Value of the Principal ($FV_P$)
FV_P = 10,000 × (1 + 0.08 / 12)^(12 × 10)
FV_P = 10,000 × (1.006667)^120 = $22,196.40
Step 2: Compute Terminal Value of Monthly Additions ($FV_A$)
i = 0.08 / 12 = 0.006667 | N = 120
FV_A = 500 × [((1.006667)^120 - 1) / 0.006667]
FV_A = 500 × [(2.219640 - 1) / 0.006667] = $91,472.97
Step 3: Calculate Cumulative Wealth & Interest Split
Total Future Value (FV) = $22,196.40 + $91,472.97 = $113,669.37 (≈ $113,873 depending on end/start cycle)
Total Out-of-Pocket Principal = $10,000 + ($500 × 120) = $70,000.00
Total Compound Interest Earned = $113,669.37 - $70,000.00 = $43,669.37 (38.4%)
Effective APY = (1 + 0.08 / 12)^12 - 1 = 8.30%
Conclusion: Due to regular dollar-cost averaging and intra-year monthly compounding, interest generation accounts for over 38% of the investor's total wealth, producing an overall equity multiplier of 1.62x.
4. Calculator Interface & Growth Projection
5. Industry Compounding Benchmarks by Asset Class
The acceleration rate of compound interest is dictated by underlying asset volatility, risk premia, and compounding cycles. The comparison matrix below details typical return profiles observed across key financial asset classes:
| Asset Class / Instrument | Typical Compounding Cycle | Historical Nominal Yield | Effective Volatility Level | Compounding Efficiency Profile |
|---|---|---|---|---|
| High-Yield Savings (HYSA) | Daily Compounding, Paid Monthly | 3.50% – 5.25% | Minimal / FDIC Insured | Steady capital preservation with minimal purchasing power erosion. |
| Certificates of Deposit (CDs) | Daily / Monthly | 4.00% – 5.50% | Zero Market Volatility | Locked liquidity; reliable compounding over fixed horizons. |
| US Treasury Notes & Bonds | Semi-Annually | 3.80% – 4.80% | Low (Duration Risk) | Consistent cash distributions suited for fixed-income reinvestment. |
| Large-Cap Equities (S&P 500) | Quarterly (Dividend Reinvestment) | 8.00% – 10.50% | Moderate / Equity Risk | High exponential growth; ideal for multi-decade horizons. |
| Corporate High-Yield Debt | Quarterly / Semi-Annually | 6.50% – 8.50% | Moderate to High Credit Risk | Accelerated cash compounding with higher credit default sensitivity. |
6. Where to Find Your Numbers
To ensure your financial projections reflect realistic macroeconomic and operational conditions, extract your input variables from verified reporting sources:
- Initial Principal ($P$): Pull current liquid balances from corporate balance sheets or personal brokerage statements. For liquidity verification, cross-reference our Working Capital Calculator to ensure operational reserves remain intact.
- Monthly Additions ($PMT$): Base your recurring additions on net operational cash flow after debt service. If you are modeling corporate retained earnings, evaluate current cash consumption using the Burn Rate Calculator.
- Nominal Return Rate ($r$): For equity portfolios, reference long-term index averages (such as the S&P 500's historic 10% gross return). For corporate hurdle rates or project evaluations, benchmark returns against figures calculated via our Growth Rate Calculator.
- Compounding Frequency ($n$): Identify this in your depository agreement, bond indenture, or mutual fund prospectus. Standard commercial retail banks compound savings accounts daily and credit balances monthly.
7. What This Calculator Can and Cannot Tell You
What It Can Tell You
- The precise mathematical impact of intra-year compounding frequencies on effective yields (APY).
- The exact inflection point where cumulative compound interest overtakes cumulative principal contributions.
- How small incremental increases in regular monthly additions compound into significant terminal wealth over long horizons.
- The nominal capital multiplier achieved across designated investment terms.
What It Cannot Tell You
- Tax Drag: It does not deduct capital gains taxes, ordinary dividend income tax, or corporate income withholding.
- Inflation Risk: Values are nominal; real purchasing power depends on prevailing Consumer Price Index (CPI) trends.
- Sequence of Returns: The model assumes constant annual yields, whereas public markets experience volatile positive and negative cycles.
- Management Fees: Expense ratios and advisory commissions will slightly compress realized net compounding curves.
8. Related Business & Financial Calculators
Integrate your wealth planning with other verified operational and valuation calculators across the Fox Business Markets analytical suite:
Revenue Forecast Calculator
Model multi-year corporate top-line growth and seasonal commercial cash trajectories.
Break-Even Calculator
Determine the exact sales volume and revenue required to offset fixed and variable overhead.
Net Profit Margin Calculator
Isolate bottom-line corporate profitability and evaluate Return on Equity (ROE).
Business Scenario Calculator
Run sensitivity models and evaluate best-case versus worst-case financial projections.
9. Frequently Asked Questions (FAQ)
What is the difference between simple interest and compound interest?
Simple interest is calculated solely as a fixed percentage of the initial principal balance throughout the lifecycle of the investment. In contrast, compound interest calculates yield on both the original principal and all previously accrued interest, resulting in an exponential rather than linear growth curve.
How much does compounding frequency actually matter?
The higher the compounding frequency, the greater the effective annual return (APY). While the gap between annual and semi-annual compounding is noticeable, the incremental return between monthly and daily compounding on modest balances is relatively compact due to mathematical convergence toward continuous compounding ($e^{rt}$).
What is the Rule of 72, and how does it relate to this calculator?
The Rule of 72 is an institutional rule of thumb used to estimate how many years it will take to double an investment at a fixed annual rate of compound interest. By dividing 72 by the annual return rate (e.g., $72 / 8 = 9$ years), you can approximate the portfolio doubling timeline generated by this calculator.
Are regular monthly additions added at the beginning or end of the period?
This calculator models standard ordinary annuities, assuming periodic contributions occur at the end of each monthly period. If contributions are deposited at the start of each month (annuity due), total accumulated interest will be marginally higher due to an additional 30 days of compounding per installment.
How does inflation affect my compound interest gains?
Inflation erodes the purchasing power of terminal dollars over time. To approximate your “real” compound return, subtract the projected annual inflation rate (CPI) from your nominal annual interest rate before calculating your terminal accumulation.
10. The Bottom Line & Authoritative References
Compound interest remains the primary mechanical driver of long-term capital formation. By reinvesting returns systematically and maintaining disciplined periodic contributions, investors harness non-linear growth curves that dramatically reduce the out-of-pocket capital required to hit target wealth milestones. Whether structuring corporate retained earnings reserves or private retirement portfolios, understanding the mathematical relationship between frequency, rate, and time is fundamental to sound balance sheet stewardship.
Authoritative References & Academic Reading:
- Federal Reserve Board (Consumer Information): Consumer guides on truth-in-savings, annual percentage yield disclosure standards, and institutional interest rate calculations.
- U.S. Securities and Exchange Commission (SEC Investor.gov): Analytical frameworks for compound interest, dollar-cost averaging, and long-term portfolio diversification.
- FINRA (Financial Industry Regulatory Authority): Capital accumulation methodologies, fixed-income compounding standards, and retirement savings projections.
- Malkiel, Burton G. (A Random Walk Down Wall Street): Canonical research regarding long-term market compound returns, reinvestment mechanics, and equity compounding efficiency.