Quick answer: The stock market is a network of exchanges where investors buy and sell shares of public companies. Prices move with supply and demand, driven by company earnings, interest rates, and the economy. Over time, U.S. stocks have returned an average of about 10% a year, though they can fall sharply in any single year.
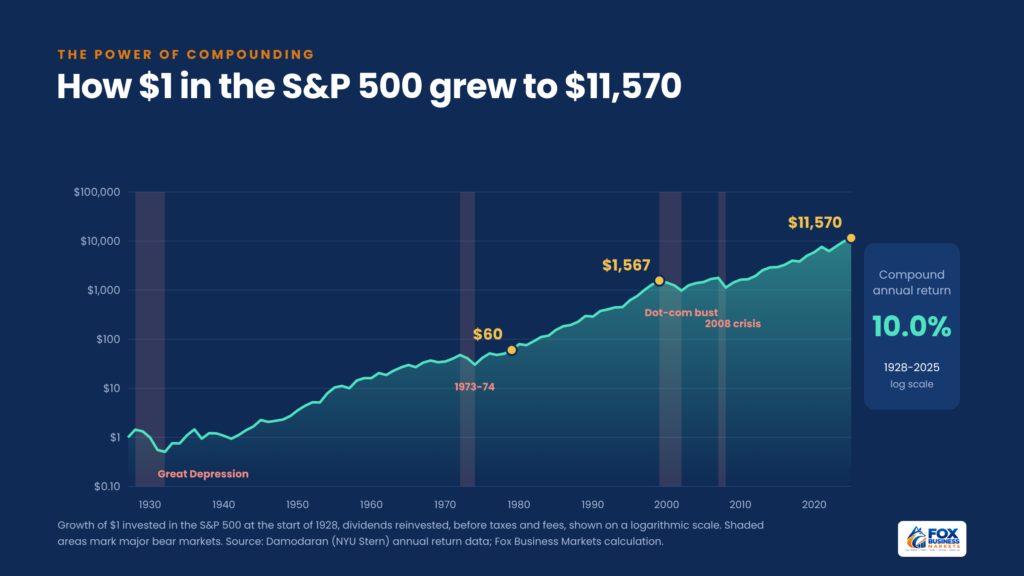
One dollar invested in the S&P 500 at the start of 1928 would have grown to about $11,570 by the end of 2025, with dividends reinvested. That’s a compound return of 10.02% a year, based on historical return data compiled by NYU professor Aswath Damodaran. The same dollar in Treasury bonds or bills would have grown far less.
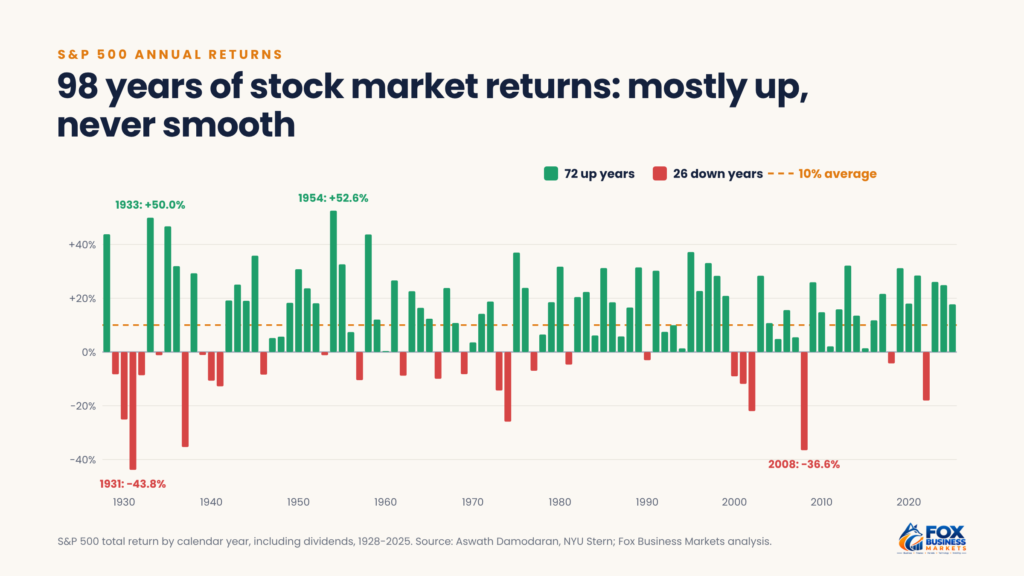
Yet the ride is rarely smooth. The S&P 500 lost money in 26 of those 98 years, including a 43.8% drop in 1931 and a 36.6% loss in 2008. And despite the long-term gains, only 56% of U.S. families owned any stock in 2025, according to the Federal Reserve’s latest Survey of Consumer Finances.
This guide explains how the stock market works, what moves prices, and how bull and bear markets play out. It also shows who keeps the system fair and how you can start investing with a plan that fits your goals.
What Is the Stock Market?
The stock market is where shares of publicly traded companies are bought and sold. A share, or stock, represents a small piece of ownership in a company. If you own shares of a company, you own a slice of its profits and assets, and you may receive part of those profits as dividends.
“The stock market” is a catch-all term. It refers to all the exchanges, trading systems, brokers, and investors that buy and sell stocks every trading day. When news reports say “the market rose 1% today,” they usually mean a major index, such as the S&P 500, gained 1%.
The U.S. stock market is the largest in the world. American companies were worth a combined $68.9 trillion at the end of 2025, 43.7% of the value of all stock markets worldwide, according to SIFMA’s 2026 Capital Markets Fact Book.
The stock market serves two main purposes:
- It helps companies raise money. A company can sell new shares to investors to fund growth, research, or expansion.
- It lets investors share in growth. Anyone with a brokerage account can buy part of a business and benefit if it grows.
How Does the Stock Market Work?
The stock market has two parts: the primary market and the secondary market.
The primary market is where companies sell new shares. The best-known example is an initial public offering (IPO), when a private company sells shares to the public for the first time. Investment banks help set the price and sell the shares, and the company receives the money. U.S. IPOs raised $47 billion in 2025, up 50% from the year before, according to SIFMA.
The secondary market is where investors trade shares with each other. This is what most people mean by the stock market. When you buy a share of a large company through your brokerage app, you’re almost always buying it from another investor, not from the company.
A typical trade works like this:
- You place an order through a broker, such as an online brokerage or app. You choose the stock, the number of shares, and the order type.
- The broker routes the order to an exchange, a market maker, or another trading venue.
- The order is matched with a seller at a price both sides accept. This takes a fraction of a second for popular stocks.
- The trade settles one business day later, known as T+1. That’s when the shares officially move to your account and the cash moves to the seller.
Prices are set by supply and demand. If more investors want to buy a stock than sell it, the price rises until enough sellers appear. If more want to sell, the price falls. Trading volume reached a record 17.6 billion shares a day on average in 2025, up 44.6% from 2024, SIFMA reports.
What Are the Major U.S. Stock Exchanges?
An exchange is a regulated marketplace that brings buyers and sellers together and publishes prices. The two largest U.S. exchanges list most of the stocks you’ve heard of.
| Exchange | Founded | Known for |
| New York Stock Exchange (NYSE) | 1792 | Many of the oldest and largest U.S. companies; trading floor on Wall Street |
| Nasdaq | 1971 | The world’s first electronic stock market; home to many technology companies |
| Cboe, IEX, and others | Various | Additional exchanges that trade stocks listed on NYSE and Nasdaq |
A company lists its shares on one exchange, but those shares can trade on many venues at once. Much trading also happens off exchanges, through market makers and alternative trading systems.
Trading hours: Regular trading runs from 9:30 a.m. to 4 p.m. Eastern time, Monday through Friday, except market holidays. Many brokers also offer premarket and after-hours trading, but those sessions often have fewer buyers and sellers and bigger gaps between buying and selling prices.
What Are Stock Market Indexes?
An index tracks the performance of a group of stocks. It gives investors a quick way to see how the market, or part of it, is doing. Here are the most-watched U.S. indexes and where they closed on Nov. 6, 2026:
| Index | What it tracks | How it’s weighted | Close (Nov. 6, 2026) | 2026 change |
| S&P 500 | About 500 large U.S. companies | By market value | 7,376.86 | +7.8% |
| Dow Jones Industrial Average | 30 large, well-known companies | By share price | 51,285.73 | +6.7% |
| Nasdaq Composite | More than 3,000 stocks listed on Nasdaq | By market value | 24,579.42 | +5.8% |
Another widely followed index, the Russell 2000, tracks about 2,000 smaller U.S. companies.
The S&P 500 is the benchmark most professionals use for the U.S. market, because it covers about 80% of the value of all U.S. stocks. In a market-value-weighted index, bigger companies have a larger effect on the index. That’s why a handful of large technology companies can move the S&P 500 on their own.
You can’t invest in an index directly, but you can buy an index fund or exchange-traded fund (ETF) that holds the same stocks. Our guide to index funds explains how they work and what they cost.
What Moves Stock Prices?
In the short run, stock prices can move for almost any reason. Over the long run, they tend to follow company profits. These are the biggest drivers:
- A company’s profits, and what investors expect them to be, are the main long-term driver. Stocks often jump or fall after quarterly earnings reports. Learn how to read an earnings report.
- Interest rates. Higher rates make borrowing more expensive and make bonds more attractive, which can pull money away from stocks. Federal Reserve decisions often move the whole market.
- The economy. Data on jobs, inflation, and consumer spending shape expectations for corporate profits.
- Investor sentiment. Fear and optimism can push prices well above or below what fundamentals suggest, at least for a while.
- Company news. New products, lawsuits, mergers, leadership changes, and guidance updates can move individual stocks sharply.
- Global events. Wars, trade policy, elections, and pandemics can shake markets worldwide.
The relationship runs both ways. Stock prices also affect the economy through household wealth and business investment, as we explain in how the stock market influences the economy.
Some traders study price charts and trading volume to time their trades, an approach called technical analysis. For an introduction, see our guide to price patterns for stock traders.
How Much Has the Stock Market Returned Over Time?
Over long periods, stocks have beaten bonds, cash, and inflation. Based on Damodaran’s data from 1928 through 2025:
- The S&P 500 returned 02% a year on average, compounded, including dividends.
- After inflation, the average real return was about 8% a year.
- Stocks gained in 72 of 98 years, or about 73% of the time.
- The best year was 1954, up 52.6%. The worst was 1931, down 43.8%.
- Six years saw losses of 20% or more: 1930, 1931, 1937, 1974, 2002, and 2008.
Recent years have been strong. The S&P 500 returned 26.1% in 2023, 24.9% in 2024, and 17.7% in 2025, and it was up about 8% in 2026 through early November, after a sharp sell-off in AI stocks on Nov. 5.
A 10% average return doesn’t mean you’ll earn 10% each year. Most years land well above or well below the average.
Compounding drives long-term growth. One dollar invested in 1928 grew to about $60 by the end of 1979 and about $1,567 by the end of 1999, before reaching about $11,570 by the end of 2025. Much of that growth came in the later decades, as gains built on gains.
What Are Bull and Bear Markets?
Investors use a few common terms to describe market swings:
| Term | Definition |
| Bull market | A long period of rising prices, often defined as a 20% gain from a low |
| Correction | A decline of 10% to 20% from a recent high |
| Bear market | A decline of 20% or more from a recent high |
| Crash | A sudden, steep drop, often over a few days |
Bear markets are a normal part of investing. Recent examples include:
- 2020: The S&P 500 fell about 34% in roughly a month as the COVID-19 pandemic spread, then recovered to a new high by August 2020.
- 2022: The index fell about 25% from January to October as inflation and interest rates rose. It didn’t reach a new high until January 2024.
- 2025: Stocks fell nearly 19% from February to April amid tariff fears, just short of an official bear market, then rebounded to new highs within a few months.
Corrections happen far more often than bear markets. Many investors expect at least one 10% decline every year or two, even in strong markets.
Declines have always been temporary for a diversified portfolio of U.S. stocks so far, but they can feel permanent while you’re living through one. Investors who sell during a downturn often miss the rebound.
Is It a Myth That the Stock Market Is Like Gambling?
Yes, for the most part. Long-term investing in a diversified portfolio isn’t gambling.
Gambling is a zero-sum or negative-sum game: the house keeps an edge, so most players lose money over time. The stock market is different. When you own a broad mix of stocks, you own a share of real businesses that produce goods, services, and profits. As those profits grow over time, the value of your shares tends to grow with them.
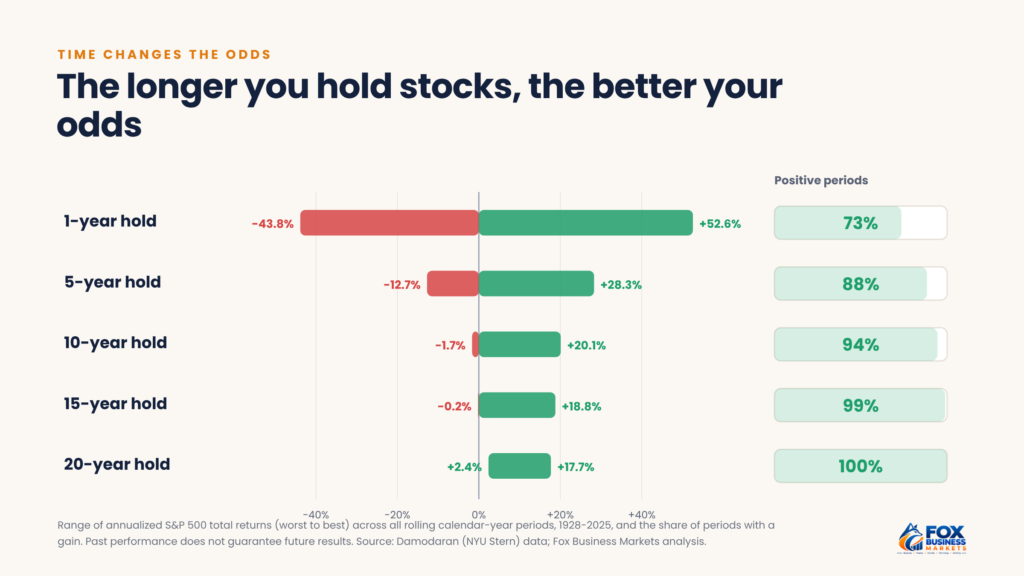
History shows how much time changes the odds. Based on calendar-year S&P 500 returns from 1928 through 2025:
- One-year periods produced gains about 73% of the time.
- Five-year periods produced gains about 88% of the time.
- 10-year periods produced gains about 94% of the time.
- 20-year periods produced gains 100% of the time, with the worst 20-year stretch still returning about 2.4% a year.
That said, the stock market can feel like gambling when people treat it that way. Betting on a single stock, trading options without understanding them, or borrowing money to trade can lead to large losses. Short-term trading is closer to speculation than investing.
Past returns don’t guarantee future results. Still, diversification and time have done most of the work.
Who Regulates the Stock Market?
Several organizations keep U.S. markets orderly and protect investors:
- Securities and Exchange Commission (SEC): The federal agency that enforces securities laws, requires public companies to disclose financial information, and oversees exchanges and brokers.
- Financial Industry Regulatory Authority (FINRA): A self-regulatory organization overseen by the SEC that licenses and regulates brokerage firms and their employees. You can check a broker’s record on FINRA’s BrokerCheck.
- Exchanges: NYSE and Nasdaq set listing standards and monitor trading on their platforms.
- Securities Investor Protection Corporation (SIPC): Protects customers up to $500,000, including $250,000 in cash, if a brokerage firm fails. It doesn’t protect against investment losses.
Markets also have built-in safety brakes. Market-wide circuit breakers pause trading for 15 minutes if the S&P 500 falls 7% or 13% from the prior day’s close before 3:25 p.m. Eastern time. A 20% drop halts trading for the rest of the day. Individual stocks can also be paused after sudden price swings.
How Many Americans Own Stocks?
Most Americans have some money in the stock market, often through a retirement plan rather than individual shares.
- 56% of U.S. families held stocks directly or indirectly, such as through a 401(k), IRA, or mutual fund, in 2025, down from 58% in 2022, according to the Federal Reserve.
- $77,400 was the median value of stock holdings among families that owned stock in 2025, up 36% from 2022.
- About 62% of U.S. adults said they owned stock in Gallup’s 2025 survey, with ownership much higher among higher-income households.
Stock ownership is uneven. Wealthier, older, and college-educated households own far more of the market than younger and lower-income households. As a result, most stock market gains go to households that already have more wealth. Workplace retirement plans and low-cost apps have helped more people take part.
For more data, see our roundup of investing statistics.
How Can You Start Investing in the Stock Market?
You don’t need a lot of money or expertise to start. Follow these steps:
- Build a cushion first. Keep an emergency fund in savings so you don’t have to sell stocks during a downturn.
- Use tax-advantaged accounts. Start with your workplace 401(k), especially if your employer matches contributions, and consider an IRA.
- Choose how you’ll invest. You can pick investments yourself through a brokerage account, use a robo-advisor that builds a portfolio for you, or work with a financial advisor.
- Start with broad funds. A low-cost S&P 500 or total market index fund gives you instant diversification.
- Invest regularly. Automatic monthly contributions, a strategy called dollar-cost averaging, help you avoid trying to time the market.
- Hold for the long term. Money you’ll need within the next few years usually belongs in savings or bonds, not stocks.
Our step-by-step guide on how to start investing covers account types, and our guide to building an investment portfolio explains how to mix stocks with other assets.
Frequently Asked Questions
Do you pay taxes on stock market gains?
Yes, in a regular brokerage account. Gains on shares held one year or less are taxed as ordinary income. Gains on shares held longer than a year qualify for lower long-term rates of 0%, 15%, or 20%, depending on your income. Investments inside a 401(k) or IRA grow without yearly tax. Tip: Hold investments for more than a year when you can, and use tax-advantaged accounts first.
What happens to your stock if a company goes bankrupt?
Shareholders are last in line. In a bankruptcy, lenders and bondholders get paid first, and stockholders often receive little or nothing. The stock may be delisted and trade over the counter at very low prices. Tip: Diversify across many companies so a single bankruptcy can’t wipe out a large part of your portfolio.
What is the difference between stocks and bonds?
A stock gives you ownership in a company, with no promised return. A bond is a loan to a company or government that pays interest and returns your principal at maturity. Stocks usually offer higher long-term returns with bigger swings, while bonds offer steadier income. Tip: Hold more bonds as you get closer to needing your money.
Can you lose more money than you invest in stocks?
Not if you buy shares with your own cash. The most you can lose is what you paid. You can lose more if you borrow money to invest (margin), sell stocks short, or trade certain options. Tip: Avoid margin and short selling until you fully understand how losses and margin calls work.
Start With One Index Fund and Give It Time
Open a retirement or brokerage account, choose one low-cost broad-market index fund, and set up an automatic monthly contribution you can keep up through good and bad markets. Leave it alone through the next correction. Historically, staying invested has worked better than trying to time the market. As your knowledge grows, add more investments and track your progress as part of your overall net worth.
This article is for general information only and isn’t financial, tax, legal, or investment advice. Consider your own situation or talk to a qualified professional before making decisions.

