Working Capital Calculator: Net Working Capital & Current Ratio
Net Working Capital (NWC) measures a company's operational liquidity, short-term financial solvency, and day-to-day managerial efficiency. By comparing current liquid assets against short-term obligations due within 12 months, this calculator computes your exact Net Working Capital dollar surplus/deficit alongside institutional liquidity multiples: the Current Ratio and the Quick Ratio (Acid-Test). Whether assessing corporate debt covenants, preparing working capital peg targets for M&A, or managing supplier trade payables, this tool delivers immediate, capital-neutral balance sheet clarity.
Who it's for: Chief Financial Officers, corporate controllers, commercial bank underwriters, private equity operations partners, and business owners managing short-term cash flow and supplier obligations.
Why use it:
- Gauge Immediate Solvency: Verify whether current liquid reserves can comfortably settle short-term vendor invoices, payroll, and debt maturities without emergency financing.
- Isolate Inventory Illiquidity: Use the integrated Acid-Test Quick Ratio to determine true solvency when warehouse inventory cannot be liquidated rapidly.
- Satisfy Commercial Loan Covenants: Ensure balance sheet ratios remain safely above commercial bank covenant minimums (typically 1.25x to 1.50x Current Ratio).
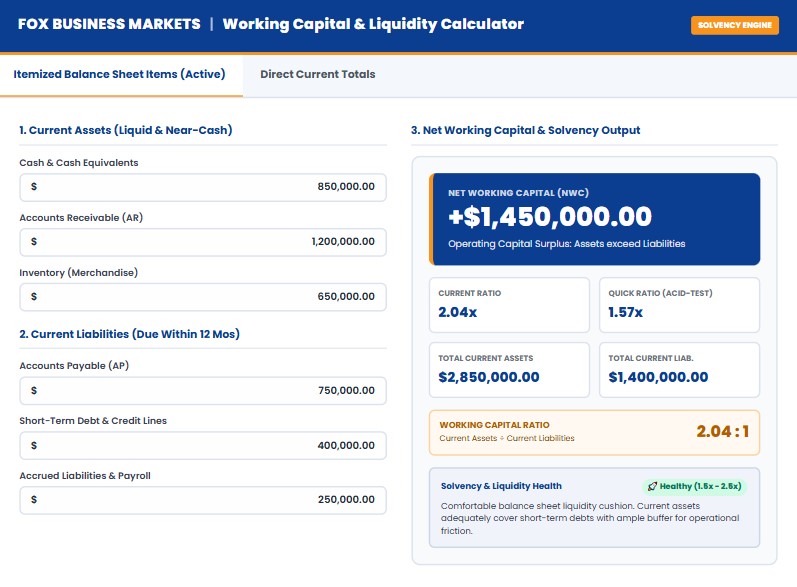
Comfortable liquidity cushion. Current assets adequately cover short-term debts with ample buffer for operational friction.
How to Use the Working Capital & Current Ratio Calculator
Measuring corporate liquidity requires comparing short-term operating resources directly against immediate legal obligations. Follow these steps to audit your balance sheet solvency:
- Select Your Input Mode: Use the Itemized Balance Sheet Items tab to break down line items (cash, trade receivables, warehouse inventory, trade accounts payable, and current debt). Alternatively, choose the Direct Current Totals tab if you already possess aggregate totals from your trial balance.
- Enter Liquid Current Assets: Input cash balances, trade accounts receivable (AR), marketable securities, and other current assets convertible to cash within 12 months. Adjust the top-bar currency selector (USD, GBP, EUR, CAD, AUD) to match your reporting ledger.
- Deduct Warehouse Inventory for Acid-Test: Ensure inventory value is populated accurately. The calculator isolates inventory from near-cash assets to generate your conservative Quick Ratio.
- Input Current Short-Term Liabilities: Enter all trade vendor payables (AP), revolving credit facilities, current portions of long-term debt maturing within one fiscal year, and accrued operational payroll.
- Evaluate Solvency Multiples: Review your net dollar cushion (Net Working Capital) alongside your Current Ratio and Quick Ratio benchmarks to verify commercial loan covenant compliance.
How It Works & Core Mathematical Formulas
Corporate liquidity relies on three standard metrics to measure operational solvency. Net Working Capital reflects liquidity in absolute currency units, while ratio multiples evaluate balance sheet safety relative to total debt scale.
Net Working Capital = Total Current Assets - Total Current Liabilities
2. Current Ratio (Working Capital Ratio):
Current Ratio = Total Current Assets / Total Current Liabilities
3. Quick Ratio (Acid-Test Ratio):
Quick Assets = Total Current Assets - Inventory - Prepaid Expenses
Quick Ratio = Quick Assets / Total Current Liabilities
4. Balance Sheet Liabilities Burden:
Current Liabilities Coverage (%) = (Total Current Liabilities / Total Current Assets) × 100
Fully Worked Numerical Example
Consider a middle-market distribution enterprise evaluating its quarterly balance sheet to secure a revolving working capital line of credit from a commercial lender.
Corporate Liquidity Case Study: Industrial Distribution Co.
- Cash & Liquid Equivalents: $850,000.00
- Accounts Receivable (Trade): $1,200,000.00
- Finished Goods Inventory: $650,000.00
- Prepaid Insurance & Other Assets: $150,000.00
- Accounts Payable (Suppliers): $750,000.00
- Short-Term Debt & Revolver Draw: $400,000.00
- Accrued Payroll & Local Taxes: $250,000.00
Step-by-Step Mathematical Execution:
- Calculate Total Current Assets: $850,000 + $1,200,000 + $650,000 + $150,000 = $2,850,000.00
- Calculate Total Current Liabilities: $750,000 + $400,000 + $250,000 = $1,400,000.00
- Calculate Net Working Capital (NWC): $2,850,000 - $1,400,000 = +$1,450,000.00 (Surplus)
- Calculate Current Ratio: $2,850,000 / $1,400,000 = 2.04x (or 2.04 : 1)
- Calculate Quick Assets: $2,850,000 - $650,000 = $2,200,000.00
- Calculate Quick Ratio (Acid-Test): $2,200,000 / $1,400,000 = 1.57x
- Calculate Liabilities-to-Assets Percentage: ($1,400,000 / $2,850,000) × 100 = 49.12%
Strategic Financial Takeaway: With a Current Ratio of 2.04x and a Quick Ratio of 1.57x, the company comfortably satisfies commercial underwriting covenants (typically 1.25x). Even if warehouse inventory sales halt entirely, liquid cash and receivables exceed short-term debt obligations by $800,000.
Industry Benchmarks Comparison Table
Acceptable working capital targets and liquidity ratios vary significantly based on cash conversion cycles, supplier trade terms, and inventory turnover velocities:
| Industry Sector | Typical Current Ratio | Typical Quick Ratio | NWC Structure Bias | Primary Liquidity Risk |
|---|---|---|---|---|
| Manufacturing & Industrial | 1.6x – 2.4x | 1.0x – 1.4x | High Positive Surplus | Raw Material Holding Costs & AR Collection Lags |
| Wholesale & Distribution | 1.5x – 2.2x | 0.9x – 1.3x | Moderate Surplus | Slow-Moving Inventory & Vendor Credit Tightening |
| Supermarkets & Food Retail | 0.8x – 1.2x | 0.3x – 0.6x | Neutral to Negative NWC | Low Risk (Rapid Cash Sales with 60-Day AP Terms) |
| SaaS & Recurring Software | 1.2x – 1.8x | 1.2x – 1.8x | Low Surplus (Zero Inventory) | Deferred Revenue & Annual Billing Churn Spikes |
| Commercial Construction | 1.3x – 1.7x | 1.1x – 1.5x | Volatile Surplus | Retainage Balances & Milestone Billing Delays |
Where to Find Your Numbers
Accurate working capital calculations require pulling clean balance sheet figures from your corporate accounting platform:
- Cash & Marketable Securities: Recorded at the top of the Current Assets section on your Balance Sheet. Reconcile against commercial treasury bank accounts.
- Accounts Receivable (AR): Extracted from your balance sheet net of allowance for doubtful accounts. Confirm turnover trends against total sales using our Revenue Forecast Calculator.
- Inventory Balances: Review ending inventory balances across raw materials, work-in-progress (WIP), and finished goods priced under FIFO or weighted average cost.
- Accounts Payable (AP): Listed under Current Liabilities. Represents all invoiced vendor purchases and supplier credit terms.
- Short-Term Notes & Current Debt: Verify through commercial loan schedules and credit facility covenants, cross-checking overall capital structure alongside our Enterprise Value Calculator.
What This Calculator Can and Cannot Tell You
What This Calculator Can Tell You:
- Whether your company possesses sufficient liquid capital to satisfy legal obligations due within 12 months without external funding.
- How much debt cushion exists before trade vendors or banking institutions face credit impairment risk.
- Whether a business meets commercial loan covenants or requires an adjustment to its working capital peg prior to an M&A transaction.
What This Calculator Cannot Tell You:
- Timing of Inflows and Outflows: A 2.0x Current Ratio does not prevent technical insolvency if a $1M debt maturity occurs tomorrow while $2M in receivables cannot be collected for 90 days. Track operating runway with our Burn Rate Calculator.
- Bad Debt Quality: If recorded accounts receivable consist of delinquent or disputed customer invoices, the true liquid Current Ratio will be materially overstated.
- Operating Profitability: A business can maintain positive working capital while burning substantial cash from unprofitable pricing structures. Audit unit margins using our Break-Even Calculator and Pricing Strategy Calculator.
Related Guides and Calculators
Balance sheet liquidity interacts directly with debt capacity, operating profitability, and enterprise valuation. Deepen your financial analysis with these related tools:
Frequently Asked Questions (FAQ)
The Current Ratio includes all current assets (cash, receivables, inventory, and prepaid expenses) relative to current liabilities. The Quick Ratio (Acid-Test) removes inventory and prepaid assets from the equation, measuring only "quick assets" that can be converted to liquid cash almost immediately. The Quick Ratio is a stricter test of immediate financial survival.
Yes, specific business models operate efficiently with negative working capital. For example, large grocery chains and e-commerce giants collect cash from retail customers immediately at checkout, but hold vendor trade payables (AP) for 60 to 90 days. This creates an operational cash float that funds expansion without external debt. However, for industrial, B2B, or project-based firms, negative working capital typically signals acute insolvency risk.
Yes. While a Current Ratio above 2.5x indicates strong debt coverage, an excessively high ratio (e.g., 4.0x or higher) often indicates operational inefficiency. It suggests the business is hoarding non-earning cash reserves, failing to collect overdue trade receivables, or carrying excessive obsolete warehouse inventory rather than reinvesting capital into growth.
In corporate acquisitions, a "working capital peg" is an agreed-upon baseline of normalized net working capital that the seller must deliver at closing. If actual working capital delivered at close falls below the target peg, the final purchase price is reduced dollar-for-dollar. If it exceeds the peg, the buyer compensates the seller for the excess liquidity.
Negotiating extended payment terms with vendors (e.g., moving from net-30 to net-60 days) increases Accounts Payable. This increases Current Liabilities, reducing Net Working Capital on paper while paradoxically preserving precious cash reserves inside the business for 30 additional days.
The Bottom Line & Authoritative References
Net Working Capital and liquidity multiples provide the definitive barometer for day-to-day operational viability, supplier confidence, and banking compliance. Maintaining a balanced liquidity buffer safeguards enterprises against economic volatility, supply chain disruptions, and unexpected customer credit defaults.
Authoritative Liquidity Standards & Financial Frameworks:
- Financial Accounting Standards Board (FASB): ASC 210 - Balance Sheet Classification of Current Assets and Liabilities
- Corporate Finance Institute (CFI): Working Capital Management and Liquidity Ratios Guide
- Harvard Business Review: How to Manage Your Working Capital (Stancill, J.M.)
- Bank of International Settlements (BIS): Working Capital Requirements and Liquidity Stress Testing