How to Use the EBITDA & EBITDA Margin Calculator
Follow these steps to reconcile core operational cash profitability from your financial statements:
- Select Currency: Choose your company's reporting currency (USD, GBP, EUR, CAD, or AUD) from the header dropdown.
- Choose Calculation Methodology: Select either Top-Down (calculating from Operating Income / EBIT) or Bottom-Up (reconciling upward from Net Income).
- Total Gross Revenue: Enter total annual or quarterly gross sales to compute percentage EBITDA Margin.
- Operating Income or Earnings Data: In Top-Down mode, input your Operating Income (EBIT). In Bottom-Up mode, enter Net Income, Interest Expenses, and Income Tax provisions.
- Non-Cash Add-Backs: Input physical asset Depreciation and intangible asset Amortization from your Cash Flow Statement to arrive at final EBITDA.
Core Formulas and Calculation Methodologies
EBITDA measures cash earnings generated by core operations prior to financing decisions, tax laws, and non-cash asset wear:
1. Top-Down Formula (from Operating Income / EBIT)
EBITDA = Operating Income (EBIT) + Depreciation + Amortization
2. Bottom-Up Formula (from Net Income)
EBITDA = Net Income + Interest Expense + Taxes + Depreciation + Amortization
3. EBITDA Margin Percentage Formula
EBITDA Margin (%) = (EBITDA ÷ Total Gross Revenue) × 100
Fully Worked Numerical Example
Consider a mid-market industrial manufacturing company reviewing its annual audited financials:
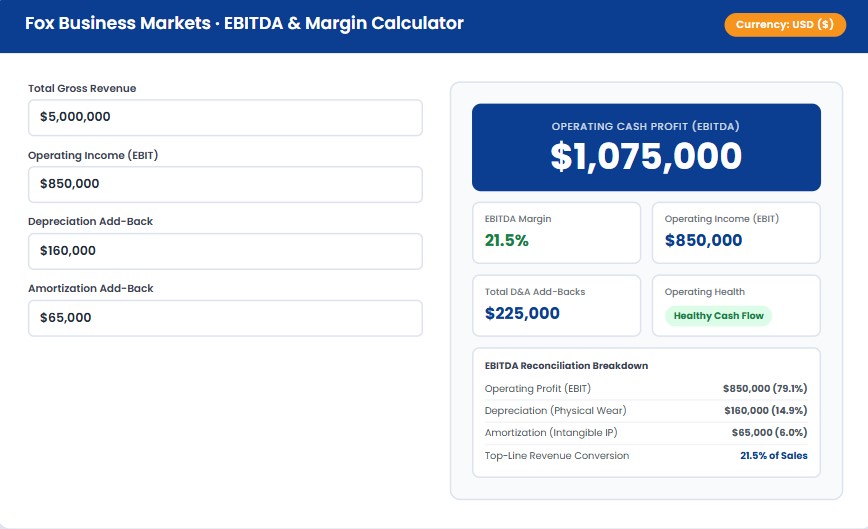
- Total Revenue: $5,000,000
- Operating Income (EBIT): $850,000
- Depreciation (Machinery & Factory): $160,000
- Amortization (Patents & Software): $65,000
Step 1: Calculate Total Non-Cash D&A Add-Backs = $160,000 + $65,000 = $225,000
Step 2: Calculate Dollar EBITDA = $850,000 (EBIT) + $225,000 (D&A) = $1,075,000
Step 3: Calculate EBITDA Margin = ($1,075,000 ÷ $5,000,000) × 100 = 21.5% EBITDA Margin
Although accounting net income or EBIT shows $850,000, the company's core operations generated $1,075,000 in raw operating cash flow, representing a strong 21.5% margin that institutional acquirers use to model debt capacity and valuation multiples.
Industry Benchmarks for EBITDA Margins
| Industry Sector | Typical EBITDA Margin Range | Median Benchmark | Capital Intensity Level |
|---|---|---|---|
| Enterprise Software (SaaS) | 20% - 35%+ | 28.0% | Low (Asset-Light) |
| Commercial Banking & Financials | 25% - 40% | 32.0% | Low Physical CapEx |
| Healthcare & Medical Technology | 18% - 28% | 22.5% | Moderate to High |
| Industrial Manufacturing & Machinery | 12% - 20% | 15.0% | High (Heavy Depreciation) |
| Retail & E-commerce | 6% - 14% | 9.5% | Moderate (Inventory Working Capital) |
Where to Find Your Numbers
Pull inputs directly from your corporate financial statements and companion analysis tools:
- Gross Revenue & Operating Income (EBIT): Look at the top section of your Income Statement (Profit & Loss). Operating Income appears directly after Gross Profit and Operating Expenses (SG&A).
- Depreciation & Amortization (D&A): Rather than looking at the P&L (where D&A is often blended into COGS or overhead), pull the exact non-cash D&A add-back directly from the Operating Activities section of your Cash Flow Statement.
- Order-Level Contribution Margins: If you are evaluating a retail brand's unit economics before calculating aggregate company EBITDA, utilize our E-commerce Profit Calculator.
- Historical Growth Context: Evaluate multi-year revenue and EBITDA expansion rates using our CAGR Calculator.
What This Calculator Can and Cannot Tell You
✔ What This Tool Tells You:
- True core operating cash earnings independent of financing structure
- Standardized profitability metric for cross-company M&A comparison
- Baseline operational cash generation available to service corporate debt
✖ What It Does Not Cover:
- Capital Expenditures (CapEx) required to replace aging equipment
- Changes in Net Working Capital (cash trapped in receivables/inventory)
- Actual cash tax outflows and contractual debt principal repayments
Related Calculators & Resources
CAGR Growth Calculator →
Calculate compound annual growth rates across revenue and EBITDA cycles.
Startup Runway Calculator →
Model cash runway and net burn rates before reaching EBITDA positive break-even.
Inventory Turnover Calculator →
Optimize operational working capital efficiency to support corporate EBITDA expansion.
Frequently Asked Questions
Why do investors and banks prefer EBITDA over Net Income?
Net Income can be heavily distorted by high interest payments from past leveraged buyouts, different state/national tax rates, and aggressive depreciation schedules. EBITDA normalizes operating performance across companies regardless of how they are capitalized or taxed.
What is Adjusted EBITDA?
Adjusted EBITDA takes standard EBITDA and adds back non-recurring, one-time, or owner-discretionary expenses (such as non-recurring legal settlements, merger integration costs, above-market owner salaries, or stock-based compensation). Private equity buyers use Adjusted EBITDA to establish the true ongoing earnings power of a target company.
What are the primary criticisms of EBITDA?
Renowned investor Warren Buffett famously criticized EBITDA because it ignores capital expenditures (CapEx). Equipment, vehicles, and software inevitably wear out and require real cash reinvestment to sustain operations. Treating depreciation as an irrelevance can make capital-intensive businesses look artificially profitable.
Authoritative References & Methodologies
- CFA Institute: Financial Reporting and Analysis — Understanding Non-GAAP Measures (EBITDA)
- Harvard Business School: Demystifying EBITDA in Mergers, Acquisitions, and Corporate Valuations