Enterprise Value Calculator: Calculate EV & Valuation Multiples
Enterprise Value (EV) is the comprehensive theoretical takeover price of a company, representing the total economic value attributed to both equity holders and debt providers. Unlike Market Capitalization—which solely measures common equity—Enterprise Value accounts for total outstanding debt, preferred equity, minority interests, and subtracts liquid cash reserves. This dual-mode calculator computes both Core Balance Sheet Enterprise Value and Market-Driven Share Valuation, while generating stepped EV/EBITDA and EV/Revenue valuation multiples for immediate M&A and institutional investment benchmarking.
Who it's for: Investment bankers, corporate finance executives, private equity analysts, startup founders preparing for acquisition, and public market investors seeking capital-structure-neutral corporate valuations.
Why use it:
- Capital Structure Neutrality: Evaluate companies on equal terms regardless of whether their operational expansion was funded via equity issuance or commercial debt leverage.
- M&A Takeover Accuracy: Accurately quantify the true net outlay required to acquire an operating entity by accounting for existing debt obligations and offset cash balances.
- Instant Peer Multiple Benchmarking: Benchmark company value against comparable peer multiples across EV/EBITDA and EV/Sales to identify market mispricings or discount valuations.
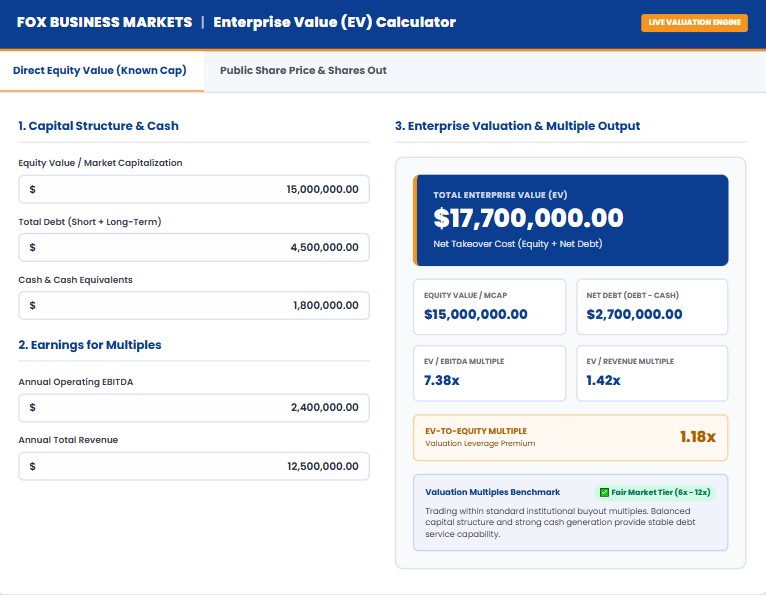
Trading within healthy historical middle-market buyout multiples. EV/EBITDA provides robust coverage for standard leveraged financing structures.
How to Use the Enterprise Value Calculator
Enterprise Value accounts for both debt claims and cash reserves to determine a company's total takeover cost. Follow these steps to perform an institutional valuation:
- Select Your Valuation Input Method: Choose the Direct Equity Value tab if analyzing a private company or when total Market Capitalization is already known. Switch to the Public Share Price & Shares Outstanding tab if analyzing publicly listed equities.
- Establish Equity Valuation: Enter either total Equity Value (Market Cap) or input the current quoted share price alongside total diluted shares outstanding. Use the currency dropdown in the top bar to adjust between USD, GBP, EUR, CAD, or AUD.
- Input Balance Sheet Debt Obligations: Enter all short-term debt, current portions of long-term loans, credit lines, and commercial notes. In an acquisition, the buyer must either assume or extinguish this debt.
- Deduct Cash & Liquid Reserves: Enter cash and cash equivalents. Because an acquirer claims all cash upon acquisition, liquid reserves reduce the effective net cost of purchase.
- Account for Preferred & Minority Interests: Enter preferred equity and non-controlling minority stakes in subsidiaries to account for senior capital claims.
- Analyze Stepped Valuation Multiples: Input operational EBITDA and annual gross revenue to inspect your EV/EBITDA and EV/Revenue multiples against sector benchmarks.
How It Works & Core Mathematical Formulas
Corporate finance relies on Enterprise Value because Market Capitalization ignores a company's capital structure. A business with a $100M market cap and $200M in debt represents a substantially different risk-return profile than a company with a $100M market cap and $50M in net cash.
Enterprise Value = Market Capitalization + Total Debt + Preferred Equity + Minority Interest - Cash & Equivalents
2. Component Formulas:
Market Capitalization = Share Price × Diluted Shares Outstanding
Net Debt = Total Debt - Cash & Cash Equivalents
Enterprise Value (Simplified) = Market Capitalization + Net Debt
3. Institutional Valuation Multiples:
EV / EBITDA Multiple = Enterprise Value / Annual Operating EBITDA
EV / Revenue Multiple = Enterprise Value / Annual Total Revenue
EV / Equity Multiple = Enterprise Value / Market Capitalization
Fully Worked Numerical Example
Consider an industrial manufacturing corporation being evaluated by a private equity sponsor for an outright acquisition.
Corporate Acquisition Case Study
- Equity Value (Market Cap): $15,000,000.00
- Total Outstanding Debt: $4,500,000.00
- Cash & Marketable Securities: $1,800,000.00
- Preferred Equity / Minority Interest: $0.00
- Annual Operating EBITDA: $2,400,000.00
- Annual Total Revenue: $12,500,000.00
Step-by-Step Mathematical Execution:
- Calculate Net Debt: $4,500,000 - $1,800,000 = $2,700,000.00
- Calculate Enterprise Value: $15,000,000 (Equity) + $2,700,000 (Net Debt) = $17,700,000.00
- Calculate EV / EBITDA Multiple: $17,700,000 / $2,400,000 = 7.38x
- Calculate EV / Revenue Multiple: $17,700,000 / $12,500,000 = 1.42x
- Calculate EV-to-Equity Ratio: $17,700,000 / $15,000,000 = 1.18x
- Calculate Net Debt Leverage of EV: ($2,700,000 / $17,700,000) × 100 = 15.25%
Strategic Interpretation: The buyer must allocate $17.7M to acquire the operating entity completely debt-free. Trading at 7.38x EV/EBITDA, the target falls within standard fair market parameters (6x–10x), providing an attractive base for senior debt syndication.
Industry Benchmarks Comparison Table
Valuation multiples differ substantially across industry verticals based on capital expenditure intensity, predictable cash flow stability, and growth trajectories:
| Industry Sector | Typical EV/EBITDA Range | Typical EV/Revenue Range | Net Debt / EV Bias | Primary Valuation Driver |
|---|---|---|---|---|
| Enterprise SaaS & Cloud | 18.0x – 35.0x | 6.0x – 12.0x | Net Cash (< 0%) | ARR Expansion & Net Retention |
| Healthcare & MedTech | 12.0x – 18.0x | 2.5x – 5.0x | 10% – 25% | Patents, Regulatory Moats |
| Industrial & Manufacturing | 6.0x – 9.0x | 1.0x – 2.0x | 20% – 40% | Asset Utilization, EBITDA Margin |
| Retail & Consumer Goods | 7.0x – 11.0x | 0.8x – 1.8x | 15% – 30% | Same-Store Sales, Gross Margin |
| Utilities & Infrastructure | 9.0x – 13.0x | 1.5x – 3.0x | 40% – 60% | Regulated Asset Base, Dividends |
Where to Find Your Numbers
To calculate Enterprise Value without bias, gather figures from your audited financial filings or corporate management accounts:
- Equity Value / Market Cap: For public companies, multiply shares outstanding by the current market price from Yahoo Finance or Bloomberg. For private companies, reference your latest 409A valuation or post-money funding round using our Business Ownership Calculator.
- Total Debt: Review the Balance Sheet under Current Liabilities (short-term notes, revolving lines of credit) and Non-Current Liabilities (senior notes, term loans, mortgage bonds).
- Cash & Equivalents: Located at the top of the Current Assets section on the Balance Sheet. Include commercial checking accounts, Treasury paper, and liquid certificates of deposit.
- EBITDA & Operating Margins: Pull Operating Income (EBIT) from the Income Statement and add back Depreciation and Amortization from the Cash Flow Statement, or calculate it directly using our core EBITDA tools.
- Revenue & Projections: Extract top-line sales from the Income Statement, or forecast future cash capacity with our Revenue Forecast Calculator.
What This Calculator Can and Cannot Tell You
What This Calculator Can Tell You:
- The comprehensive price tag required to acquire an entire business and assume its balance sheet net liabilities.
- How heavily leveraged a business is relative to its enterprise valuation.
- Whether a company trades at a discount or premium relative to peer enterprise multiples (EV/EBITDA and EV/Sales).
What This Calculator Cannot Tell You:
- Off-Balance Sheet Liabilities: EV does not automatically capture operating lease obligations under older accounting standards, unfunded pension commitments, or pending legal liabilities.
- Working Capital Normalization: A buyer often must inject additional working capital post-close. Verify operational liquidity thresholds using our Break-Even Calculator.
- Cash Quality: EV treats all cash equally, but restricted cash in foreign escrow accounts or cash trapped abroad subject to repatriation taxes cannot be easily drawn down post-acquisition.
Related Guides and Calculators
Enterprise valuation connects balance sheet leverage, operating earnings, and corporate growth strategy. Expand your corporate finance analysis with these related tools:
Frequently Asked Questions (FAQ)
In an acquisition, the buyer acquires all assets of the target company, including its cash and cash equivalents. If a buyer pays $10 million for an enterprise that holds $2 million in liquid bank reserves, the buyer can immediately use that cash to offset purchase debt, making the effective economic purchase price $8 million.
Yes. When a company holds more cash and liquid marketable investments than its total outstanding debt obligations (known as having Net Cash), its Enterprise Value will be lower than its Market Capitalization. This is common among highly profitable enterprise software and technology conglomerates.
P/E measures Price relative to Net Income, which is heavily distorted by debt interest expenses, tax jurisdictions, and non-cash accounting depreciation schedules. EV/EBITDA compares the value of the entire operating business against operational cash flow before capital structure distortions, making it capital-structure-neutral and superior for comparative peer analysis.
Equity Value (Market Cap) represents the value available strictly to common shareholders. Enterprise Value represents the value of the core business operations accessible to all capital providers—including common equity holders, preferred shareholders, and debt lenders.
EV/Revenue (EV/Sales) is primarily used when valuing high-growth startups, early-stage technology companies, or businesses undergoing turnarounds that generate negative or minimal EBITDA. It evaluates valuation scale independent of near-term operating profitability.
The Bottom Line & Authoritative References
Enterprise Value provides the definitive baseline for corporate valuation, institutional buyouts, and balance sheet capital allocation. By isolating core operations from financing structure choices, EV enables analysts and leadership teams to compare disparate businesses accurately across global capital markets.
Authoritative Valuation Standards & Methodologies:
- Corporate Finance Institute (CFI): Enterprise Value Formula and Valuation Mechanics
- NYU Stern School of Business (Damodaran, A.): Valuation Multiples and Capital Structure Neutrality
- McKinsey & Company: Valuation: Measuring and Managing the Value of Companies
- CFA Institute: Equity Valuation and Multiples Analysis in Mergers & Acquisitions