How to Use the Inventory Turnover Calculator
Follow these steps to measure stock movement speed and evaluate total warehouse carrying drag:
- Select Currency: Choose your operating currency (USD, GBP, EUR, CAD, AUD) from the top-right dropdown.
- Cost of Goods Sold (COGS): Enter the total direct material, manufacturing, and landed product expenses recorded during the evaluated timeframe. Do not use gross sales revenue.
- Beginning Inventory: Enter your ending inventory valuation from the prior period (valued at cost, not retail price).
- Ending Inventory: Enter your physical inventory value on hand at the end of the evaluated period.
- Measurement Period: Select whether your COGS figures reflect an Annual (365 days), Quarterly (90 days), or Monthly (30 days) operating window.
- Holding Cost Rate (%): Input your estimated carrying cost percentage (typically 15% to 30% for warehousing, insurance, damage, and working capital interest).
Core Formulas and Calculation Mechanics
Inventory turnover evaluates how efficiently working capital converts into fulfilled customer orders. The engine runs on four core accounting equations:
1. Average Inventory Formula
Average Inventory = (Beginning Inventory + Ending Inventory) ÷ 2
2. Inventory Turnover Ratio
Inventory Turnover = Cost of Goods Sold (COGS) ÷ Average Inventory
3. Days Sales of Inventory (DSI / Days on Hand)
DSI (Days) = (Average Inventory ÷ COGS) × Days in Period = Days in Period ÷ Inventory Turnover
4. Annual Inventory Carrying Cost
Holding Cost = Average Inventory × Carrying Cost Percentage
Fully Worked Numerical Example
Consider an e-commerce home goods retailer reviewing their annual fiscal performance:
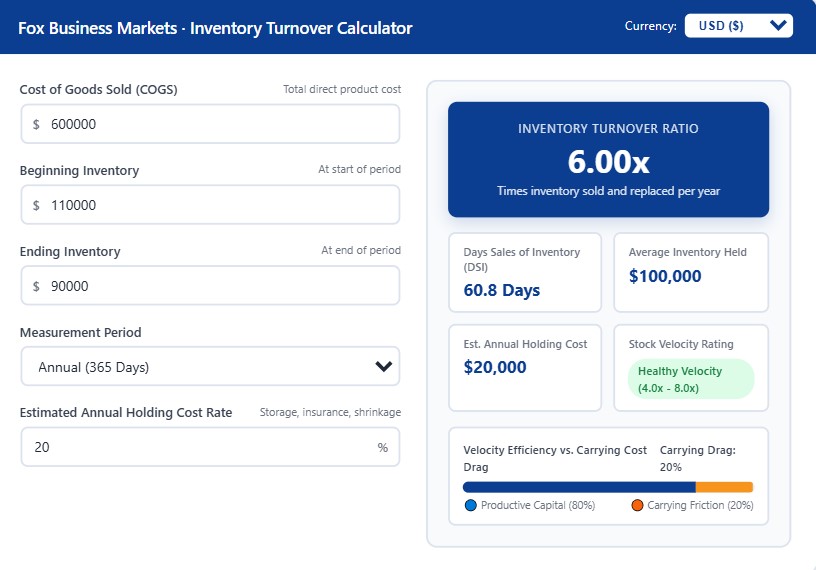
- Cost of Goods Sold (COGS): $600,000
- Beginning Inventory: $110,000
- Ending Inventory: $90,000
- Period: 365 Days (Full Year)
- Carrying Cost Rate: 20.0%
Step 1: Calculate Average Inventory = ($110,000 + $90,000) ÷ 2 = $100,000
Step 2: Calculate Turnover Ratio = $600,000 ÷ $100,000 = 6.00x (The retailer turns over its stock 6 times per year)
Step 3: Calculate Days on Hand (DSI) = 365 ÷ 6.00 = 60.8 Days (It takes an average of ~61 days to sell through stock)
Step 4: Calculate Annual Holding Drag = $100,000 × 20% = $20,000 per year in warehousing and financing fees
A 6.0x turnover indicates healthy operational rhythm. If this brand can improve supplier lead times to reach 8.0x turns, average inventory drops to $75,000, immediately freeing up $25,000 in working capital and cutting carrying fees by $5,000 annually.
Industry Benchmarks for Inventory Turns & DSI
| Retail / Product Category | Typical Turnover Ratio | Average DSI (Days on Hand) | Efficiency Rating |
|---|---|---|---|
| Grocery & Fast-Moving Consumer Goods (FMCG) | 12.0x - 18.0x | 20 - 30 Days | Very High Velocity |
| Apparel & Fashion E-Commerce | 4.0x - 7.0x | 52 - 90 Days | Moderate / Seasonal |
| Consumer Electronics | 5.0x - 8.5x | 43 - 73 Days | High / Obsolescence Risk |
| Luxury Goods & Fine Jewelry | 1.5x - 2.5x | 145 - 240 Days | Slow Velocity (High Margin) |
Where to Find Your Numbers
To calculate accurate turnover, pull financial and physical counts from your accounting software and companion planning tools:
- Cost of Goods Sold (COGS): Export your standard Income Statement (P&L) from QuickBooks, Xero, or NetSuite. Never use Top-Line Sales Revenue, as doing so inflates turns by including your profit markup.
- Inventory Asset Value: Pull the "Inventory Asset" line from your Balance Sheet at the start and end of the period.
- Cash Flow & Runway Correlation: Sluggish inventory turns tie up liquid capital. Check the effect of trapped inventory on your business survival horizon using our Startup Runway Calculator.
- Unit Economics & Margin Targets: Model pricing and margin thresholds to determine markdowns for slow-moving stock using our Pricing Strategy Calculator.
What This Calculator Can and Cannot Tell You
✔ What This Tool Tells You:
- How many times your aggregate stock turns per reporting cycle
- Average days required to transform purchased goods into cash
- Financial burden created by warehouse holding, shrinkage, and insurance
✖ What It Does Not Cover:
- SKU-level performance (fast movers masking dead stock)
- Supplier manufacturing lead times and freight shipping transit days
- Stockout penalty costs (missed revenue during out-of-stock periods)
Related Calculators & Resources
Frequently Asked Questions
Why should I use COGS instead of Sales Revenue to calculate turnover?
Sales revenue includes your retail markup, while inventory on your balance sheet is recorded at cost. Dividing retail sales revenue by cost-basis inventory produces an artificially high turnover figure that misrepresents actual unit movement.