How to Use the Marketing Budget Calculator
Follow these steps to establish an annual marketing allocation and divide spend across individual acquisition channels:
- Select Currency: Select your reporting currency (USD, GBP, EUR, CAD, AUD) from the top-right menu.
- Projected Annual Revenue: Enter your projected top-line gross revenue for the upcoming fiscal year.
- Growth Stage / Posture: Select your operational stage (from 5% maintenance posture up to 25% hyper-growth posture) or enter a custom percentage.
- Adjust Channel Splits: Move the sliders to allocate capital across Paid Ads, SEO/Content, Creative Production, and Marketing Software until the sum balances to 100%.
- Review Run-Rate Figures: Check your monthly and quarterly burn figures to ensure marketing expenditures align with working capital limits.
Core Formulas and Budget Allocation Mechanics
Enterprise marketing planning relies on a top-down percentage model followed by bottom-up tactical allocation:
1. Total Annual Marketing Budget
Annual Marketing Budget = Projected Gross Revenue × (Marketing Budget % ÷ 100)
2. Periodic Run-Rate Allocation
Monthly Budget = Annual Budget ÷ 12 | Quarterly Budget = Annual Budget ÷ 4
3. Normalized Channel Allocation Formula
Channel Capital = Annual Budget × (Channel Percentage ÷ Total Allocation Sum)
Fully Worked Numerical Example
Consider an expanding direct-to-consumer brand evaluating its annual growth plan with the following targets:
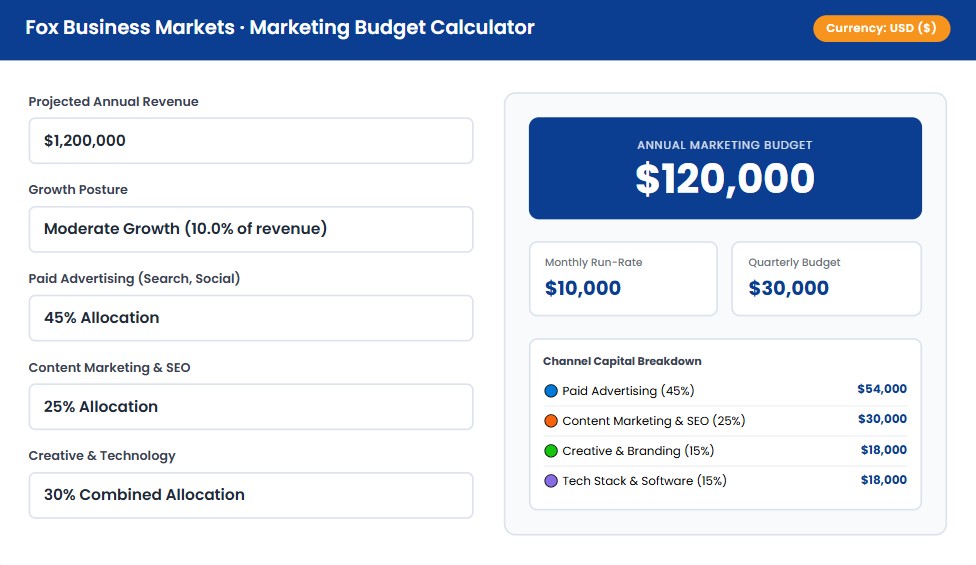
- Projected Gross Revenue: $1,200,000
- Target Allocation: 10.0% of revenue (Standard Growth Posture)
- Channel Strategy: 45% Paid Ads, 25% Content/SEO, 15% Creative, 15% Tech Stack
Step 1: Annual Marketing Budget = $1,200,000 × 0.10 = $120,000
Step 2: Monthly Operating Run-Rate = $120,000 ÷ 12 = $10,000 per month
Step 3: Paid Media Allocation = $120,000 × 45% = $54,000 ($4,500/mo)
Step 4: Content & SEO Allocation = $120,000 × 25% = $30,000 ($2,500/mo)
Step 5: Creative & Tech Allocation = $120,000 × 15% each = $18,000 each ($1,500/mo)
Industry Benchmarks for Marketing Budgets as a % of Revenue
| Industry Sector | Maintenance Mode | Standard Growth | Aggressive Expansion |
|---|---|---|---|
| B2B Software (SaaS) | 8% - 12% | 14% - 20% | 25% - 40%+ |
| Consumer E-Commerce / D2C | 6% - 9% | 10% - 15% | 18% - 30% |
| B2B Professional Services | 4% - 6% | 7% - 10% | 12% - 16% |
| Healthcare & Medical Devices | 3% - 5% | 6% - 9% | 10% - 15% |
Where to Find Your Numbers
To ensure your budget remains sustainable, audit your baseline metrics against our companion tools:
- Revenue Projections: Review trailing financial statements and historical compounding rates via our CAGR Calculator.
- Target Acquisition Spend: Cross-check channel budgets against expected customer volumes using our CAC Calculator.
- Ad Profitability Ceilings: Ensure your paid media allocation maintains positive returns using our ROAS Calculator.
- Runway Verification: Before committing to aggressive ad spend, verify that cash reserves won't deplete prematurely with our Startup Runway Calculator.
What This Calculator Can and Cannot Tell You
✔ What This Tool Tells You:
- Total recommended annual and monthly marketing spend
- Balanced channel division preventing over-reliance on paid ads
- Standard benchmark ranges tailored to your growth ambitions
✖ What It Does Not Cover:
- Internal team salary structures vs. external agency retainers
- Seasonal spend spikes (e.g., Q4 holiday retail surge)
- Campaign-level creative performance decay
Related Calculators & Resources
Frequently Asked Questions
What percentage of revenue should a business spend on marketing?
Most established businesses spend between 7% and 12% of gross revenue on marketing. High-growth B2B software brands and new consumer retail startups often invest 15% to 25%+ to capture market share rapidly before tapering down to maintenance levels.
Does this marketing budget include internal employee salaries?
Traditionally, marketing budgets are divided into "Program Spend" (direct media costs, agency retainers, tools, and content production) and "People Costs" (internal full-time salaries). This calculator models program operational spend. If internal salaries are included, bump your allocation target by 4% to 6% of revenue.
How should I allocate budget between paid media and SEO/organic?
A healthy standard ratio is 45% to 55% for paid advertising (for immediate pipeline generation) and 20% to 30% for SEO and organic content (for long-term compounding customer acquisition). Allocating over 70% to paid ads increases risk if advertising costs rise suddenly.
Authoritative References & Methodologies
- Gartner: The Annual CMO Spend Survey & Marketing Budget Benchmarks
- U.S. Small Business Administration (SBA): Managing Your Business Finances: Marketing Budget Allocations