How to Use the Conversion Rate Calculator
Follow these step-by-step instructions to calculate conversion rates, analyze A/B test lift, and model visitor revenue:
- Select Currency: Choose your target currency (USD, GBP, EUR, CAD, AUD) from the top-right dropdown.
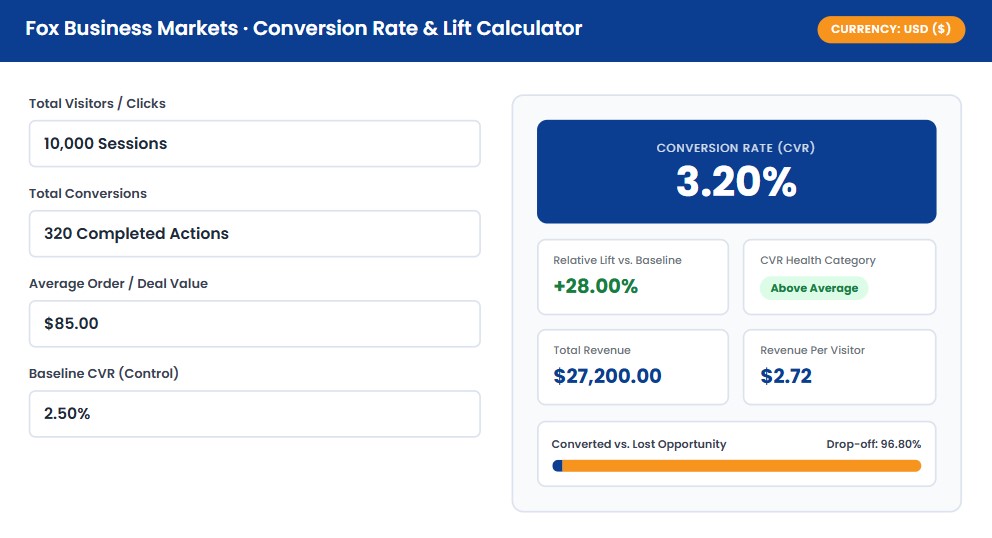
- Total Visitors / Clicks: Enter the number of unique visits, ad clicks, or sessions recorded during the evaluation window.
- Total Conversions: Enter the quantity of completed conversion actions (orders, signed contracts, email opt-ins, or demo requests).
- Average Order / Deal Value: Enter the mean gross revenue generated per completed conversion to calculate Revenue Per Visitor (RPV).
- Baseline CVR for Comparison: Enter your control variant or historical conversion percentage to compute relative A/B test lift.
Core Formulas and Calculation Mechanics
Conversion metrics evaluate the efficiency of converting interest into measurable enterprise value. The calculator utilizes four foundational formulas:
1. Conversion Rate (CVR) Formula
Conversion Rate (%) = (Total Conversions ÷ Total Visitors) × 100
2. Relative Conversion Lift (A/B Testing)
Relative Lift (%) = [ (New CVR - Baseline CVR) ÷ Baseline CVR ] × 100
3. Revenue Per Visitor (RPV)
RPV = Total Generated Revenue ÷ Total Visitors = CVR × Average Order Value (AOV)
4. Traffic Drop-Off Rate
Drop-off Rate (%) = 100% - Conversion Rate (%)
Fully Worked Numerical Example
Suppose an e-commerce fashion retailer launches a redesigned checkout flow with the following performance data:
- Total Visitors: 25,000 sessions
- Completed Orders: 875 checkouts
- Average Order Value (AOV): $92.00
- Baseline Control CVR: 2.80%
Step 1: Calculate New Conversion Rate = (875 ÷ 25,000) × 100 = 3.50%
Step 2: Calculate Relative Lift = [ (3.50% - 2.80%) ÷ 2.80% ] × 100 = +25.00% Lift
Step 3: Total Revenue = 875 × $92.00 = $80,500.00
Step 4: Revenue Per Visitor (RPV) = $80,500 ÷ 25,000 = $3.22 per visitor (vs. $2.58 baseline RPV)
A 0.70 percentage-point absolute improvement generated an additional $16,100 in topline sales from the identical traffic base without incurring any additional ad spend.
Industry Benchmarks for Conversion Rates
| Industry / Channel | Low (Bottom 25%) | Median Average | High-Performing (Top 10%) |
|---|---|---|---|
| E-Commerce Retail | < 1.4% | 2.0% - 2.8% | > 4.2% |
| B2B SaaS (Free-to-Paid) | < 1.8% | 3.0% - 4.5% | > 7.0% |
| Lead Generation Landing Pages | < 2.5% | 4.0% - 6.5% | > 11.5% |
| Financial Services & Insurance | < 1.2% | 2.1% - 3.4% | > 5.8% |
Where to Find Your Numbers
To ensure high calculation accuracy, pull and verify your baseline data using your internal analytics stack and our companion calculators:
- Google Analytics 4 (GA4): Navigate to Reports → Engagement → Conversions to export sessions vs. key events.
- Paid Ad Platforms: Review total clicks against tracked attribution events in Google Ads, Meta Ads Manager, and LinkedIn Campaign Manager. Pair this with our ROAS Calculator to confirm campaign margins.
- Unit Economics Validation: When conversion rates improve, your acquisition cost drops automatically. Track this ongoing efficiency using our CAC Calculator and Customer Lifetime Value (LTV) Calculator.
What This Calculator Can and Cannot Tell You
✔ What This Tool Tells You:
- Exact conversion percentage across any funnel step
- Relative lift percentage achieved between test variants
- Revenue per visitor (RPV) benchmarks to optimize bidding
✖ What It Does Not Cover:
- Statistical significance (p-values) or minimum sample sizes
- Qualitative customer feedback explaining why users bounce
- Post-purchase return rates or payment processing chargebacks
Related Calculators & Resources
Frequently Asked Questions
What is the difference between absolute lift and relative lift?
Absolute lift is the simple difference between two rates (e.g., jumping from 2.0% to 3.0% is a 1.0 percentage point absolute increase). Relative lift measures that change against the baseline (e.g., (3.0 - 2.0) ÷ 2.0 = +50.0% relative lift). Relative lift accurately reflects growth trajectory.
What is a good conversion rate for Google Ads vs. Meta Ads?
Google Search Ads typically average 3.5% to 5.0% because searchers possess high intent. Social display channels (Meta, TikTok) average between 1.0% and 2.2% because traffic is discovery-based, requiring stronger retargeting and frictionless landing page architecture.
Why is Revenue Per Visitor (RPV) often more important than CVR?
If you discount prices heavily, your conversion rate might double while your revenue per visitor decreases. RPV integrates both conversion percentage and transaction size, ensuring you never sacrifice profit margins solely to boost conversion counts.
Authoritative References & Methodologies
- Nielsen Norman Group: Conversion Rates & User Experience Research Benchmarks (Nielsen, J.)
- MIT Sloan Management Review: The Mathematics of Online Experimentation and A/B Testing (Kohavi, R.)