Quick answer: The price-to-earnings (P/E) ratio divides a stock’s share price by its earnings per share. It shows how much investors pay for each $1 of profit. A higher P/E usually means investors expect faster growth or the stock is pricey, while a lower P/E can mean a bargain or a business in trouble.
The S&P 500 traded at about 25 times its past year of earnings in early November 2026, well above its average of roughly 19 since 1950, according to Multpl. The cyclically adjusted version, the Shiller CAPE ratio, stood near 39, close to the record set during the dot-com bubble.
Yet by another measure, stocks look reasonably priced. Analysts expect S&P 500 earnings to jump 33% in 2026 and keep rising. Based on expected earnings for the next 12 months, the index trades at 17.7 times earnings, below both its 5-year and 10-year averages, according to FactSet. The same market can look expensive or cheap depending on which P/E you use.
This guide explains how to calculate and read the P/E ratio, the difference between trailing and forward P/E, what nearly a century of data says about high valuations and future returns, and how to use P/E without falling into its traps.
What Is a P/E Ratio?
The P/E ratio is a valuation measure. It tells you how many dollars investors are paying for each dollar a company earns in profit.
If a stock has a P/E of 20, investors are paying $20 for every $1 of annual earnings. If another company in the same industry has a P/E of 10, its earnings cost half as much.
Investors use the P/E ratio to:
- Compare companies in the same industry
- Compare a stock with its own history to see whether it’s priced higher or lower than usual
- Gauge the overall market, using the P/E of an index such as the S&P 500
- Spot expectations, since a high P/E usually means investors expect strong growth
The P/E ratio is one of the most widely quoted numbers on any stock page. It’s a starting point for research, not a final answer. For more on how stock prices are set, see our guide to how the stock market works.
How Do You Calculate the P/E Ratio?
The formula:
P/E ratio = share price ÷ earnings per share (EPS)
Earnings per share is a company’s net profit divided by its number of shares outstanding. You’ll find it in the company’s quarterly and annual reports. Our guide on how to read an earnings report shows where to look.
Example: A company earned $500 million last year and has 100 million shares outstanding, so its EPS is $5. If the stock trades at $100, its P/E is 100 ÷ 5 = 20.
You can also flip the ratio. Earnings yield = EPS ÷ price. A P/E of 20 equals an earnings yield of 5%. Some investors compare earnings yield with bond yields to judge whether stocks are attractive.
What Is the Difference Between Trailing and Forward P/E?
The P/E you see depends on which earnings figure is used.
| Trailing P/E | Forward P/E | |
| Earnings used | Actual earnings over the past 12 months | Analysts’ estimates for the next 12 months |
| Strength | Based on real, reported results | Reflects where the business is heading |
| Weakness | Looks backward; can be distorted by a one-time event | Estimates can be wrong, often too optimistic |
| Best for | Stable companies with steady profits | Fast-changing or fast-growing companies |
When earnings are growing quickly, forward P/E will be much lower than trailing P/E. That’s the situation in late 2026, as the table later in this guide shows: analysts expect profits to keep climbing.
If the estimates prove too high, the forward P/E understates how expensive stocks really are. That’s why many investors check both.
What Is a Good P/E Ratio?
No single P/E is “good” for every stock. A reasonable P/E depends on several factors:
- Fast-growing companies usually deserve higher P/Es, because their earnings are expected to be much larger in the future.
- Technology and health care companies often trade at higher P/Es than banks, energy companies, or utilities.
- Companies with steady, predictable profits can justify higher P/Es than cyclical businesses whose earnings swing with the economy.
- Interest rates. When rates are low, investors tend to accept higher P/Es. When rates rise, P/Es often fall.
- Two companies with the same P/E can carry very different risk if one has far more debt.
As a rough guide, the S&P 500’s trailing P/E has averaged about 19 since 1950. A stock well above its industry and its own history needs strong growth to justify its price.
How Do P/E Ratios Differ by Sector?
P/E ratios vary widely across industries, so always compare a stock with others in its sector. FactSet’s forward P/E figures for six S&P 500 sectors as of Nov. 5, 2026, show how wide the spread can be:
Sector | Forward 12-month P/E |
| Consumer discretionary | 24.3 |
| Consumer staples | 23.7 |
| Industrials | 21.7 |
| Information technology | 17.3 |
| Financials | 15.0 |
| Energy | 11.7 |
Energy and financial stocks usually trade at lower P/Es because their profits rise and fall with oil prices and interest rates. Investors pay less for earnings they consider less predictable.
Technology’s forward P/E (17.3) was lower than consumer staples’ and below its own 25-year average of 20.0. FactSet said it was the sector’s lowest forward P/E since March 2020. Tech companies’ profits have grown so fast that their share prices look less expensive compared with expected earnings. Consumer staples companies, which sell everyday goods, grow more slowly but are valued for their stability.
This is why a P/E of 20 can be cheap for one company and expensive for another. Compare like with like.
How Do Interest Rates Affect P/E Ratios?
Interest rates are one of the biggest forces behind market P/E ratios. When investors can earn more from safe bonds, they’re less willing to pay high prices for stock earnings.
A simple way to see this is to compare the stock market’s earnings yield, the inverse of the P/E, with bond yields. A forward P/E of 17.7 equals an earnings yield of about 5.6%. When Treasury yields are well below 5.6%, stocks look attractive by comparison. When Treasury yields rise toward the earnings yield, stocks lose some of their edge.
By one measure, stocks’ edge over bonds is unusually thin. In October 2026, the gap between the CAPE earnings yield and the inflation-adjusted 10-year Treasury yield fell to its lowest level since 2002, according to an analysis by TheTrading.Tools.
Rising rates also affect companies directly. Higher borrowing costs can cut into profits, and future earnings are worth less in today’s dollars when rates are high. That hits fast-growing companies hardest, since more of their value depends on profits years from now.
Some of the lowest market P/Es came during periods of high inflation and interest rates, such as the late 1970s and early 1980s, when the S&P 500’s trailing P/E fell below 8. Apart from earnings collapses such as 2009, the highest came when rates were low or falling, as in the late 1990s and the early 2020s.
What Is the S&P 500’s P/E Ratio Today?
Here are three common ways to measure the market’s valuation, and where each stood in early November 2026:
Measure | Current | Long-term comparison | What it suggests |
| Forward P/E (next 12 months) | 17.7 | 10-year average of 19.1; 5-year average of 19.8 | Below average |
| Trailing P/E (past 12 months) | About 25.1 | About 18.7 average since 1950 (January values) | Above average |
| Shiller CAPE (10-year average earnings, inflation-adjusted) | About 38.9 | About 18 average since 1900 (January values) | Far above average |
Sources: FactSet (forward P/E, as of Nov. 5, 2026, reported Nov. 6); Multpl (trailing P/E and CAPE, as of Nov. 6, 2026).
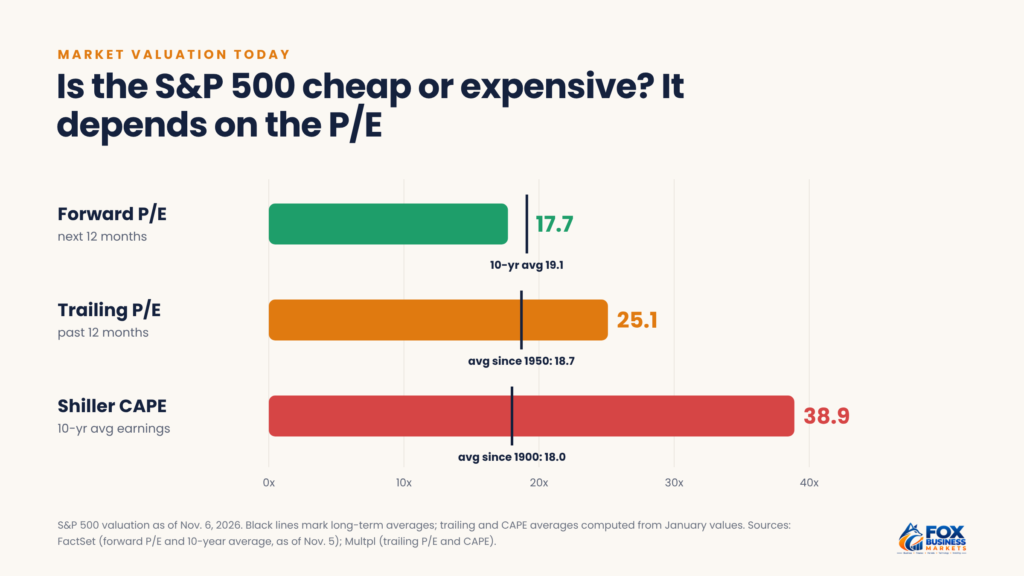
The gap between these measures comes from earnings growth. FactSet reported blended third-quarter 2026 earnings growth of 31.4%, the third straight quarter above 25%. Forward P/E gives credit for that growth. CAPE averages a decade of earnings, so it reacts slowly when profits surge.
What Is the Shiller CAPE Ratio?
The cyclically adjusted price-to-earnings ratio, or CAPE, was popularized by Nobel Prize-winning economist Robert Shiller. It divides the S&P 500’s price by the average of the past 10 years of earnings, adjusted for inflation.
Using a 10-year average smooths out booms and recessions. A single year of very high or very low profits won’t swing the ratio much. That makes CAPE useful for judging the market’s long-term valuation, though it isn’t meant for timing short-term moves.
CAPE has hit high levels only a few times:
- 1929: about 27 at the start of the year, before the Great Crash
- 1966: about 24 before a long stretch of weak returns
- 2000: about 44 at the peak of the dot-com bubble
- 2026: about 39, second only to the dot-com peak
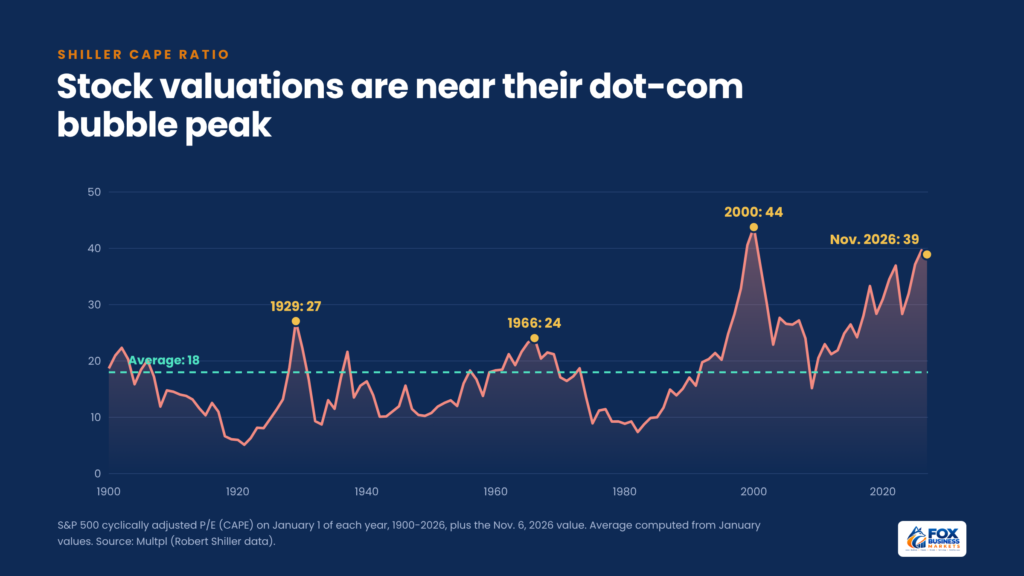
Critics argue that CAPE overstates today’s valuations. Accounting rules have changed, companies pay out less in dividends and buy back more stock, and today’s largest companies are more profitable than past leaders. Those changes may be one reason CAPE has stayed above its long-term average for most of the past three decades while stocks kept rising.
Does a High P/E Predict Lower Returns?
Over long periods, yes, more often than not. Over short periods, not reliably.
We compared the S&P 500’s CAPE at the start of each year from 1928 to 2016 with the stock market’s average annual total return over the following 10 years, using CAPE data from Multpl and return data from NYU professor Aswath Damodaran. Across 89 starting years:
Starting CAPE | Number of years | Average 10-year annual return | Range |
| Under 10 | 10 | 13.9% | 5.4% to 17.4% |
| 10 to 15 | 24 | 14.6% | 6.3% to 20.1% |
| 15 to 20 | 22 | 9.8% | -0.6% to 19.0% |
| 20 to 25 | 21 | 8.2% | -0.9% to 16.4% |
| 25 to 30 | 7 | 7.0% | -1.7% to 13.0% |
| Over 30 | 5 | 1.6% | -1.4% to 5.8% |
Cheaper starting points have generally been followed by higher returns, and expensive ones by lower returns. The correlation between starting CAPE and the next decade’s return was about -0.66, a fairly strong relationship by market standards.
But the relationship is loose for any single year. Investors who sold stocks when CAPE climbed above 25 in 1997 missed three more years of strong gains, and CAPE has stayed high for most of the period since 2016 while returns remained strong. Valuation tells you more about the odds over a decade than about what happens next year.
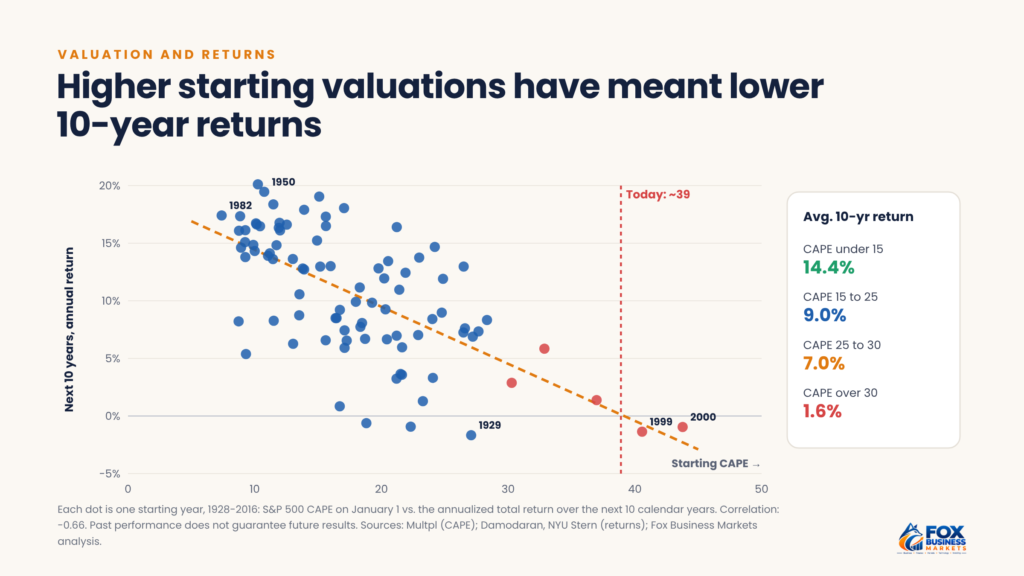
For long-term investors, the takeaway isn’t to sell when valuations look high. It’s to set realistic expectations, stay diversified, and keep investing on a schedule. Our guide on how to buy stocks covers dollar-cost averaging and other ways to invest steadily.
Is It a Myth That a Low P/E Means a Stock Is Cheap?
Yes. A low P/E can signal a bargain, but it often signals trouble. Investors call these stocks value traps.
A P/E is low when the price is low compared with earnings. That can happen for good reasons, such as when the market overlooks a solid company. It can also happen because investors expect earnings to fall. Common causes include:
- Peak earnings in cyclical industries. Automakers, steelmakers, and energy companies often look cheapest at the top of the business cycle, right before profits drop.
- A shrinking business. A company losing customers may have a low P/E because its earnings are expected to keep declining.
- One-time gains. A big asset sale can inflate a single year’s earnings and make the P/E look artificially low.
- Heavy debt. Investors may price in the risk that debt payments will crowd out future profits.
Before buying a low-P/E stock, ask why it’s cheap. Check whether revenue and earnings are growing, how much debt the company carries, and whether its dividend is safe. Our guide to dividend stocks explains how to check a payout ratio, which can reveal similar warning signs.
What Is the PEG Ratio?
The PEG ratio adjusts the P/E for expected growth:
PEG ratio = P/E ratio ÷ annual earnings growth rate (in %)
A company with a P/E of 30 and expected earnings growth of 30% a year has a PEG of 1.0. A company with a P/E of 15 and 5% growth has a PEG of 3.0. Even though the second stock has the lower P/E, the first may be the better value given its growth.
A PEG near 1 is often considered fairly valued, below 1 potentially undervalued, and well above 1 potentially expensive. But PEG depends on growth forecasts, which can be wrong, especially for fast-growing companies. You can estimate growth rates with our earnings growth calculator.
What Are the Limits of the P/E Ratio?
The P/E ratio is useful, but it has blind spots:
- Negative or tiny earnings. Companies that lose money have no meaningful P/E. When earnings are close to zero, the P/E can be huge. The S&P 500’s trailing P/E jumped above 70 in early 2009 because earnings collapsed, not because stocks were expensive.
- Accounting choices. Earnings can be affected by one-time charges, write-downs, and different accounting methods. Many companies also report “adjusted” earnings that exclude certain costs.
- Debt isn’t included. P/E looks only at the stock price, not the company’s total debt. Enterprise value measures, such as EV/EBITDA, account for debt.
- Different business models. P/E works poorly for banks during credit crises, real estate investment trusts, and early-stage companies.
- It ignores quality. P/E doesn’t tell you about a company’s competitive strength, management, or cash flow.
Use P/E alongside other measures, such as price-to-sales, price-to-book, free cash flow yield, and debt levels, rather than on its own.
How Do You Use the P/E Ratio When Picking Stocks?
A practical approach:
- Start with trailing and forward P/E. Note both and see how far apart they are.
- Compare with peers. Look at competitors in the same industry, not the whole market.
- Compare with the stock’s own history. Check whether today’s P/E is above or below its 5- and 10-year average.
- Check growth. Calculate the PEG ratio, and look at revenue and earnings trends.
- Look at the balance sheet. Make sure debt is manageable.
- Ask what the market expects. A high P/E means investors expect a lot. Decide whether the company can deliver.
- Keep the big picture in mind. For most investors, diversification and low costs drive results more than finding the perfect P/E. Broad index funds let you own the whole market at its average valuation.
Frequently Asked Questions
Where can you find a stock’s P/E ratio?
Most brokerage apps, financial news sites, and stock screeners list the P/E ratio on each stock’s quote page, usually as the trailing 12-month figure. Some also show forward P/E. Tip: Check which earnings figure a site uses, since sites may show different P/E numbers for the same stock.
How often does a P/E ratio change?
A stock’s P/E changes every trading day as its price moves. The earnings part usually updates once a quarter, when the company reports results. Tip: Check the P/E again after each earnings report, since a new quarter of profits can shift it sharply even if the price barely moves.
What is the difference between P/E and price-to-book?
P/E compares price with earnings, while price-to-book (P/B) compares price with the company’s net assets, or book value. P/B is often more useful for banks and insurers, whose assets are mostly financial. Tip: Use P/B alongside P/E when analyzing financial companies.
Do ETFs and index funds have a P/E ratio?
Yes. A fund’s P/E combines the P/E ratios of the stocks it holds, weighted by each holding’s size. Providers usually use a weighted harmonic average so that very high P/Es don’t distort it. Fund providers often list it on the fund’s fact sheet. Tip: Compare a fund’s P/E with its benchmark to see whether it leans toward growth or value stocks.
Check the P/E Before You Buy, Then Look Deeper
Before your next stock purchase, look up both the trailing and forward P/E, compare them with the company’s peers and its own history, and calculate the PEG ratio. Then dig into earnings quality, debt, and growth. For the market as a whole, use valuation to set expectations, not to time your trades, and keep building your investment portfolio steadily. Our investing statistics offer more context on long-term returns.
This article is for general information only and isn’t financial, tax, legal, or investment advice. Consider your own situation or talk to a qualified professional before making decisions.

