Quick answer: U.S. stocks were worth $68.9 trillion at the end of 2025, or 43.7% of the global market. The S&P 500 has returned about 10% a year since 1928 and was up 7.8% in 2026 through Nov. 6. About 56% of U.S. families own stock, but the wealthiest 10% hold about 88% of it.
The S&P 500 has compounded about 10% a year since 1928, but it landed between 8% and 12% in only four of those 98 years, based on historical return data from NYU professor Aswath Damodaran. In 36 years it gained 20% or more. In 12 years it lost more than 10%.
The rest of the numbers are just as uneven. More than half of American families own stock, yet the bottom half of households by wealth holds less than 1% of it. Retail traders made up roughly a fifth of all trading in 2025, and 2026 has already set a record for initial public offering (IPO) dollars raised, even though October’s IPO count was barely a third of the month’s 10-year average.
This roundup collects the latest stock market statistics on market size, 2026 performance, long-term returns, ownership, trading, funds, dividends, concentration, IPOs, and valuations. A closing section explains what the numbers mean for your own investing.
Stock Market Statistics at a Glance
- $68.9 trillion: value of U.S. stocks at the end of 2025, 43.7% of the world total (Securities Industry and Financial Markets Association, or SIFMA).
- 8%: S&P 500 price gain in 2026 through Nov. 6, after a record close of 7,818.93 on Oct. 6.
- 02% a year: S&P 500 compound annual return from 1928 through 2025, with dividends reinvested (Damodaran).
- 72 of 98 years: calendar years in which the S&P 500 gained, about 73%.
- 56%:S. families owning stock directly or indirectly in 2025, down from 58% in 2022 (Federal Reserve).
- 88%: share of stocks and mutual fund shares held by the wealthiest 10% of households in mid-2026 (Federal Reserve).
- 6 billion: average number of U.S. shares traded per day in 2025, a record (SIFMA).
- 20% to 25%: retail investors’ share of U.S. trading activity in 2025 (J.P. Morgan, via Reuters).
- 5%: share of long-term fund assets held in index funds in September 2026 (Investment Company Institute).
- $78.92: record dividends per share paid by S&P 500 companies in 2025 (S&P Dow Jones Indices).
- $148.6 billion: raised by U.S. IPOs in 2026 as of early November, a full-year record (Renaissance Capital).
- About 39: the S&P 500’s Shiller cyclically adjusted price-to-earnings (CAPE) ratio in November 2026, a level topped only in the dot-com era and earlier in 2025-26 (Multpl).
How Big Is the U.S. Stock Market?
The U.S. stock market is by far the largest in the world. According to SIFMA’s 2026 Capital Markets Fact Book, U.S. stocks were worth $68.9 trillion at the end of 2025. That was:
- 7% of the $157.8 trillion global equity market
- 4 times the size of China’s stock market
- Part of a global market that grew 18.9% in 2025
Trading hit a record. An average of 17.6 billion shares changed hands each day in 2025, up 44.6% from 2024. U.S. companies raised $232.6 billion by selling new stock that year, excluding special purpose acquisition companies (SPACs), and $47 billion of that came from IPOs.
Stocks also make up the largest slice of household savings. SIFMA counts $80.4 trillion in U.S. household liquid assets in 2025, and equities accounted for 57.2% of the total, well ahead of mutual funds, bank deposits, and bonds.
For a primer on how exchanges, brokers, and indexes fit together, see our guide to how the stock market works.
How Has the Stock Market Performed in 2026?
Stocks are on track for a fourth straight yearly gain, but the ride has been bumpy. The S&P 500 closed at a record 7,818.93 on Oct. 6. By Nov. 6, after a sharp sell-off in artificial intelligence (AI) stocks the day before, it had slipped to 7,376.86, about 5.7% below that peak.
Index | Close on Dec. 31, 2025 | Close on Nov. 6, 2026 | 2026 change |
| S&P 500 | 6,845.50 | 7,376.86 | +7.8% |
| Dow Jones Industrial Average | 48,063.29 | 51,285.73 | +6.7% |
| Nasdaq Composite | 23,241.99 | 24,579.42 | +5.8% |
Price changes only; dividends not included. Sources: SIFMA (2025 closes), index providers (2026 closes).
Strong earnings have supported this year’s gain. FactSet reported on Nov. 6 that S&P 500 companies were on track for 31.4% earnings growth in the third quarter of 2026, and analysts expected 33.3% growth for the full calendar year.
The last three years set a high bar. The S&P 500 returned 26.1% in 2023, 24.9% in 2024, and 17.8% in 2025, including dividends.
What Are the Stock Market’s Long-Term Returns?
Over long periods, U.S. stocks have beaten bonds, cash, and inflation by a wide margin. Damodaran’s data for 1928 through 2025 show:
- 02% a year: the S&P 500’s compound annual return, with dividends reinvested
- About 11.9%: the simple average of the 98 annual returns, which runs higher because big losses drag down compound growth
- About 6.8% a year: the compound return after inflation
- About $11,580: what $1 invested at the start of 1928 grew to by the end of 2025
- 72 up years and 26 down years
Single years rarely look like the average. The S&P 500’s best year was 1954, up 52.6%, and its worst was 1931, down 43.8%. Most years land well above or well below 10%:
- Only four years (1968, 1993, 2004, and 2016) returned between 8% and 12%.
- 36 years, more than a third, returned 20% or more.
- 12 years lost more than 10%.
- The most common range was 10% to 20%, which covered 21 years.
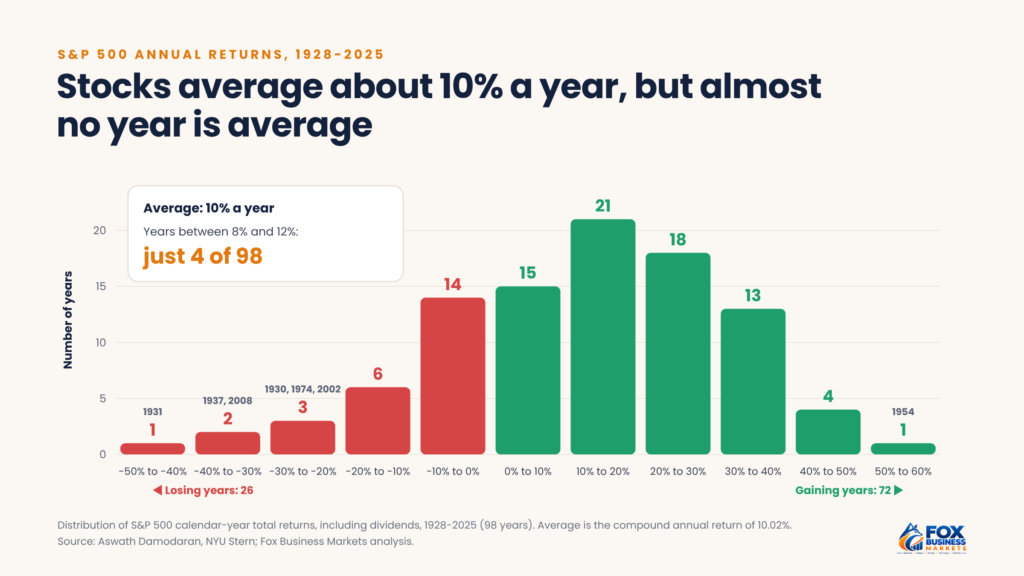
Histogram of S&P 500 annual total returns from 1928 to 2025
Time has smoothed out those swings. Since 1928, the S&P 500 has delivered a gain over every 20-year period, with the worst 20-year stretch still returning about 2.4% a year. One-year periods were positive only about 73% of the time.
How Have Returns Varied by Decade?
Returns have run in long waves. Two decades, the 1930s and the 2000s, delivered slightly negative returns, while the 1950s, 1980s, and 1990s averaged better than 17% a year.
Decade | S&P 500 average annual return | What drove it |
| 1930s | -0.9% | Great Depression |
| 1940s | 8.5% | World War II and postwar boom |
| 1950s | 19.5% | Postwar growth, low starting valuations |
| 1960s | 7.7% | Steady growth, rising inflation late |
| 1970s | 5.9% | Oil shocks and high inflation |
| 1980s | 17.3% | Falling interest rates |
| 1990s | 18.0% | Tech boom |
| 2000s | -1.0% | Dot-com crash and 2008 financial crisis |
| 2010s | 13.4% | Low rates and recovery |
| 2020-2025 | 14.9% | Pandemic rebound and AI boom |
Compound annual total returns, including dividends, not adjusted for inflation. Source: Damodaran, NYU Stern; Fox Business Markets analysis.
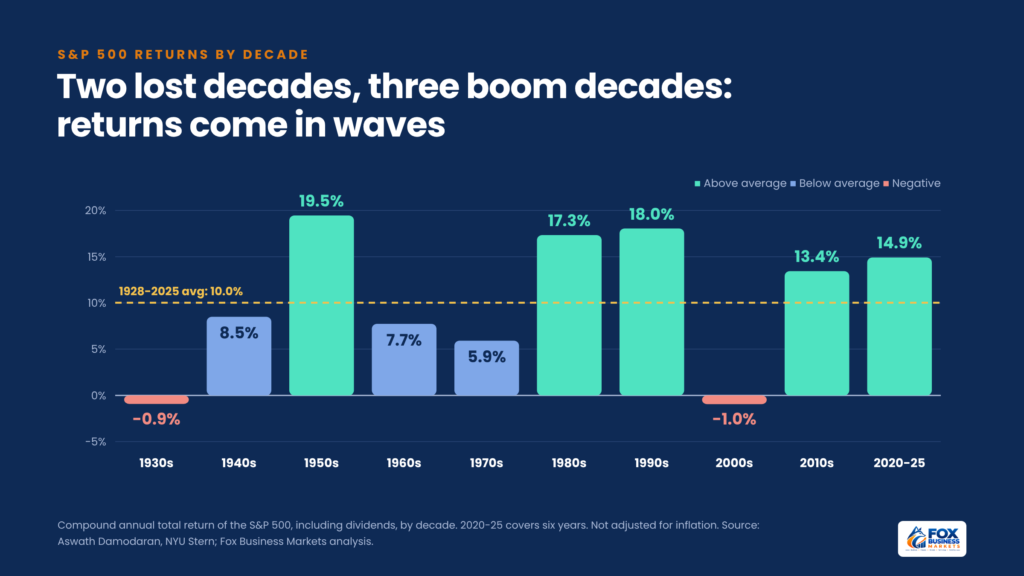
S&P 500 average annual return by decade from the 1930s to the 2020s
A weak decade often followed a period of high prices. The 2000s began with the S&P 500 at a record valuation, and investors who bought at the start of 2000 had slightly less money 10 years later, even with dividends reinvested. Starting valuations can’t predict a single year, but they have been a rough guide to returns over a decade. Our guide to the price-to-earnings (P/E) ratio explains how investors measure them.
How Many Americans Own Stocks?
Most American families own at least some stock, usually through a retirement account. The Federal Reserve’s 2025 Survey of Consumer Finances, released in October 2026, found:
- 56% of families held stock directly or indirectly, such as through a 401(k), individual retirement account (IRA), or mutual fund, down from 58% in 2022 but above 53% in 2019.
- 19% owned individual stocks directly, down from 21% in 2022.
- 9% had a retirement account.
- $77,400 was the median value of stock holdings among families that owned stock, up 36% from 2022.
Gallup measures ownership differently, by asking adults whether they own any stock. In its April 2026 survey, 58% of U.S. adults said yes, down from 62% in 2025 and the first decline since 2016.
Ownership varies sharply by income. According to the Fed’s summary report on family finances, 97% of families in the top 10% of income owned stock in 2025, compared with 31% of families in the bottom half. The Fed says the bottom half accounted for nearly all of the drop in participation since 2022.
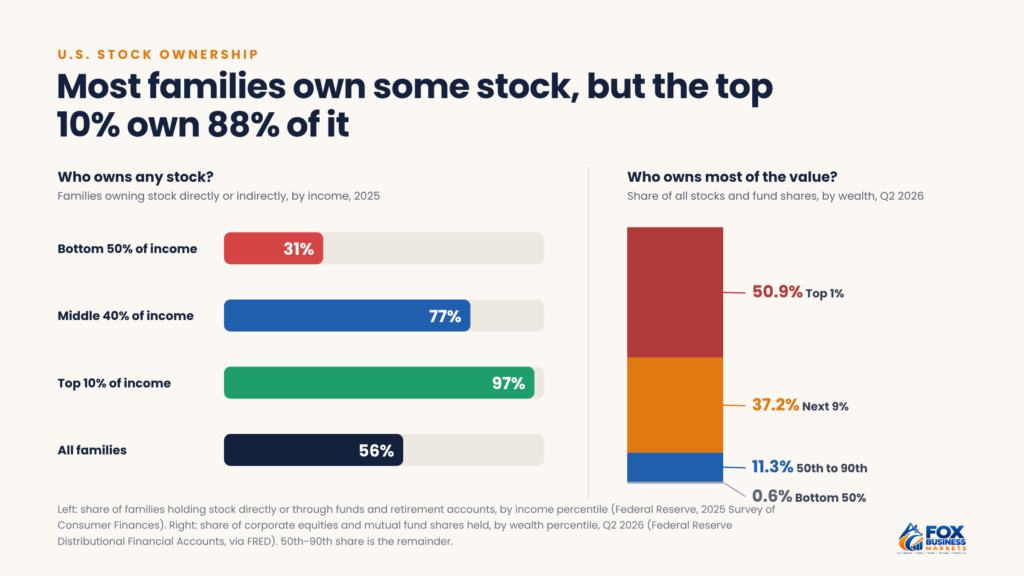
Share of U.S. families owning stock by income group in 2025
If you’re in the group without investments yet, our guide to how to start investing covers the first steps, and our walkthrough on how to buy stocks explains accounts and order types.
How Much Do Retail Investors Trade?
Individual investors, often called retail investors, now account for a much larger share of trading than they did a decade ago. Key figures:
- 20% to 25%: retail investors’ share of U.S. stock trading activity in 2025, peaking near 35% in April 2025, according to J.P. Morgan data reported by Reuters.
- Record inflows:P. Morgan estimated that retail investors put more new money into U.S. stocks in 2025 than in any prior year, about 14% more than at the 2021 meme-stock peak.
- More than 20%: Jefferies analysts’ estimate of retail’s share of U.S. trading volume in 2025, with an even higher share in stocks priced under $5.
App-based brokers keep growing. Robinhood reported 28.7 million funded customers and $396 billion in platform assets at the end of the third quarter of 2026, according to its Q3 2026 results. Its customers traded a record $992 billion of stock in the quarter, up 53% from a year earlier. For more on investing apps and digital brokers, see our fintech statistics.
How Much Money Is in Index Funds?
Index funds now hold more money than actively managed funds. According to the Investment Company Institute (ICI), index mutual funds and exchange-traded funds (ETFs) held $22.14 trillion at the end of September 2026, compared with $18.47 trillion in active funds. That puts index funds at 54.5% of long-term fund assets.
Low costs explain much of the shift. Index funds track a benchmark such as the S&P 500 instead of paying managers to pick stocks, so their fees are usually much lower. Our guide to index funds compares the main types.
What Do Dividend Statistics Show?
S&P 500 companies paid a record $78.92 per share in dividends in 2025, up 5.5% from 2024 and the 16th straight year of higher payments, according to S&P Dow Jones Indices. About 81% of companies in the index pay a dividend.
Yields, however, are near historic lows. The S&P 500’s dividend yield was about 1.1% in early November 2026, compared with 7.4% at the end of 1950. Stock prices have risen faster than payouts, and companies now return much of their cash through share buybacks instead. Our guide to dividend stocks covers yields, payout ratios, and reinvestment.
How Concentrated Is the Stock Market?
A small group of very large companies now moves the whole market. In the SPDR S&P 500 ETF (SPY), the 10 largest holdings made up 37.9% of the fund as of its June 2026 filing, according to ChartRow estimates from Securities and Exchange Commission (SEC) filings. That share was 22.8% in September 2019 and peaked at 40.7% in December 2025.
Company | Weight in SPY (June 2026) |
| Nvidia | 7.5% |
| Apple | 6.6% |
| Alphabet (Class A) | 5.8% |
| Microsoft | 4.3% |
| Amazon | 3.6% |
Alphabet’s Class C shares are held separately, so the company’s total weight is higher. Source: ChartRow, from SEC filings.
That concentration cuts both ways. When large tech stocks rally, the S&P 500 rises quickly. When they fall, as they did in the Nov. 5 AI sell-off, the index drops with them, even if most other stocks hold up. Investors who own an S&P 500 fund alongside large tech stocks may hold more of the same companies than they realize, which is one reason to review your investment portfolio regularly.
Long-term data show how lopsided stock returns can be. Arizona State University professor Hendrik Bessembinder studied about 26,000 U.S. stocks from 1926 to 2016 and found that about 4% of them created all of the stock market’s net wealth above Treasury bill returns. About 58% of individual stocks failed to beat Treasury bills over their lifetimes.
What Do IPO Statistics Show for 2026?
2026 is already a record year for IPO dollars, thanks to a few giant deals:
- $148.6 billion raised by 121 U.S. IPOs in 2026 as of early November, according to Renaissance Capital, topping the full-year record of $142.4 billion set in 2021.
- SpaceX listed on Nasdaq on June 12, 2026, in the largest IPO on record. It raised about $86 billion including additional shares sold to underwriters, as reported by Fortune.
- SK hynix, the South Korean memory-chip maker, raised $26.5 billion in July, the largest U.S. IPO ever by a foreign company, topping Alibaba’s $25 billion in 2014.
- $141.2 billion had already been raised by mid-July, according to Renaissance Capital data reported by Axios.
The number of deals tells a different story. EY counted 72 U.S. IPOs in the first half of 2026, down 35% from 111 a year earlier. Activity slowed further in the fall. Renaissance Capital counted eight IPOs raising about $1.2 billion in October, well below the 10-year October average of 22 deals and $5.1 billion. Its IPO index fell 10% that month, while the S&P 500 lost 1%.
How Expensive Is the Stock Market Right Now?
By most measures, U.S. stocks are priced well above their long-term averages:
- Trailing P/E: about 25.1 in early November 2026, versus an average of about 18.7 since 1950 (Multpl).
- Shiller CAPE: about 39, down from 41 in August 2026, according to Multpl’s monthly data. Only the dot-com era, which peaked at about 44 in December 1999, saw higher readings before 2025. The long-term average is about 17 to 18, depending on whether monthly or January readings are used.
- Forward P/E:7 as of Nov. 5, 2026, below the 10-year average of 19.1, according to FactSet. Strong expected earnings growth keeps this measure lower.
High valuations don’t predict what happens next month or next year. Historically, though, years that started with a high CAPE ratio were followed by lower average returns over the next decade. Our P/E ratio guide walks through the data.
Is It a Myth That Most Americans Have a Big Stake in Stocks?
Mostly, yes. A majority of families own some stock, but most of the money sits with a small group.
According to the Federal Reserve’s Distributional Financial Accounts, the wealthiest 1% of U.S. households held 50.9% of all corporate stock and mutual fund shares in the second quarter of 2026, up from 42.8% in 1989. The next 9% held another 37.2%, bringing the top 10% to about 88%. The bottom half of households held about 0.6%.
This gap explains why a record stock market doesn’t lift every household equally. For many families, a stake in stocks means a modest 401(k) balance, not a large portfolio.
What Do These Stock Market Statistics Mean for You?
Five lessons stand out:
- Expect uneven years. A 10% long-term average has come with frequent 20% gains and occasional 30% or 40% losses. Plan for both.
- Give stocks time. Losses over one year have been common, but no 20-year period since 1928 has lost money before inflation.
- Mind today’s starting point. Past periods that began with CAPE above 30 were followed by below-average 10-year returns.
- Check your concentration. An S&P 500 fund puts about 38% of your money in its 10 largest holdings.
- Keep costs low. The shift to index funds reflects how much fees can reduce returns over decades.
For broader numbers on savings, retirement accounts, and investor behavior, see our investing statistics.
Frequently Asked Questions
How many trading days are in a year?
U.S. stock markets are usually open about 252 days a year. They close on weekends and on market holidays such as Thanksgiving and Christmas. In 2026, the New York Stock Exchange has 251 trading days. Tip: Check the exchange holiday calendar before scheduling trades or transfers near a holiday.
What time does the stock market open?
The New York Stock Exchange and Nasdaq hold regular trading from 9:30 a.m. to 4 p.m. Eastern time, Monday through Friday. Some days, such as the day after Thanksgiving, close early at 1 p.m. Tip: Avoid placing market orders right at the open, when prices can swing sharply.
What is the difference between a correction and a bear market?
A correction is a decline of 10% to 20% from a recent high. A bear market is a drop of 20% or more. Corrections happen far more often, and many end within a few months. Tip: Decide in advance how you’ll respond to a 20% decline so you don’t sell in a panic.
Where can you find official stock market statistics?
Reliable sources include the Federal Reserve for ownership and wealth data, SIFMA for market size and trading, S&P Dow Jones Indices for index and dividend data, and the Investment Company Institute for fund flows. Tip: Check the “as of” date on any statistic, since market figures change daily.
Use These Numbers to Set Realistic Expectations
Stock market statistics show both the long-run growth of stocks and the short-run swings that come with it. U.S. stocks have compounded at about 10% a year for nearly a century, but few individual years came close to that average, and today’s high valuations may mean slower gains ahead.
Recheck these figures each quarter, and build a plan that can handle a 30% drop without forcing you to sell.
This article is for general information only and isn’t financial, tax, legal, or investment advice. Consider your own situation or talk to a qualified professional before making decisions.

