Quick answer: Payment statistics show Americans made 236.6 billion noncash payments in 2024, mostly by card, according to the Federal Reserve. In 2025, credit cards were the most-used payment method at about 34% of consumer payments, debit followed at 31%, and cash fell to about 14%. The ACH Network moved $93 trillion in 2025, and instant payments are growing fast.
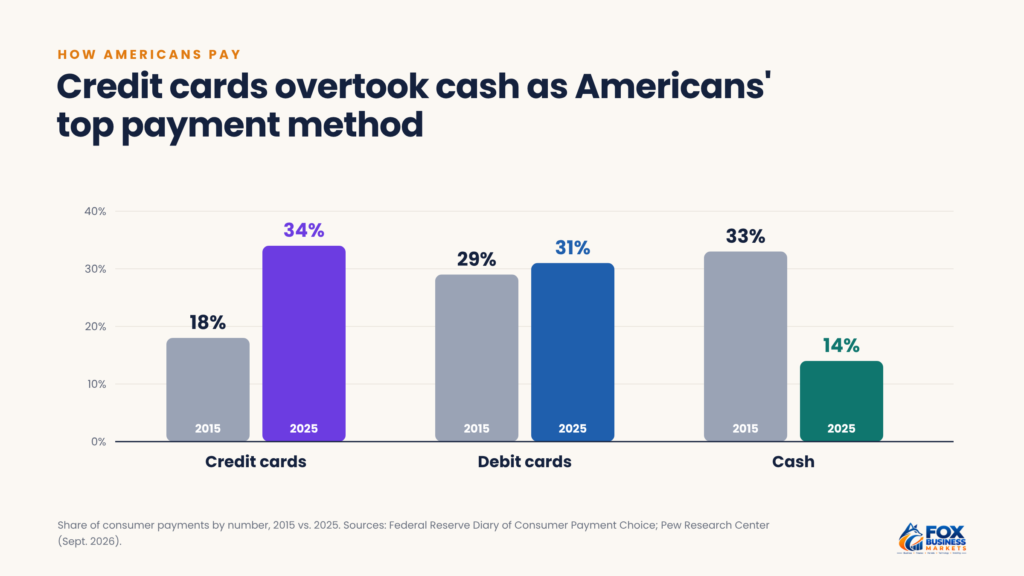
Credit cards have been the most-used payment method since 2022 and accounted for about 34% of consumer payments in 2025, nearly double their 18% share in 2015, according to Pew Research Center’s analysis of Federal Reserve data. Cash, which led a decade ago with a third of all payments, fell to about 14%.
Yet the shift to digital payments isn’t complete, and it isn’t free. Merchants paid $198.25 billion in card processing fees in 2025, cash still covers about 14% of consumer payments, and nearly half of buy now, pay later users paid late on at least one loan in the past year.
This roundup gathers the latest payment statistics from the Federal Reserve, Nacha, the Nilson Report, Pew Research Center, Zelle, and LendingTree, covering cards, cash, ACH, instant payments, peer-to-peer apps, and buy now, pay later, with what each trend means for businesses.
Payment Statistics at a Glance
Statistic | Latest figure | Source and date |
| Total U.S. noncash payments | 236.6 billion, worth $140 trillion | Federal Reserve Payments Study, 2024 data (July 2026) |
| Card payments (credit, debit, prepaid) | 187.7 billion | Federal Reserve Payments Study, 2024 data |
| Credit cards’ share of consumer payments | About 34% | Federal Reserve Diary of Consumer Payment Choice, 2025 |
| Debit cards’ share of consumer payments | About 31% | Diary of Consumer Payment Choice, 2025 |
| Cash’s share of consumer payments | About 14% | Diary of Consumer Payment Choice, 2025 |
| Americans who use no cash in a typical week | 42% | Pew Research Center, 2026 |
| U.S. card purchase volume | $12.498 trillion | Nilson Report, 2025 |
| Card processing fees paid by U.S. merchants | $198.25 billion | Nilson Report, 2025 |
| ACH Network payments | 35.2 billion, worth $93 trillion | Nacha, 2025 |
| Zelle payments | $1.2 trillion across 4.2 billion transactions | Zelle, 2025 |
| FedNow instant payments | 6.4 million payments worth $370.9 billion | Federal Reserve, Q3 2026 |
| BNPL users who paid late in the past year | 47% | LendingTree, 2026 |
For how these payments move behind the scenes, see our guide to payment processing.
How Many Noncash Payments Do Americans Make?
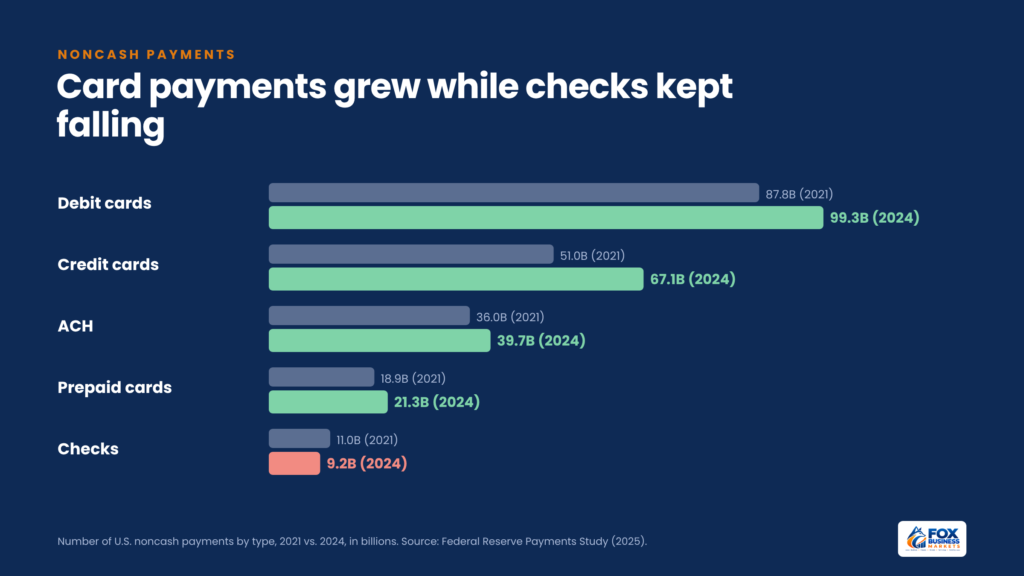
Americans made 236.6 billion noncash payments worth $140.01 trillion in 2024, up from 204.8 billion worth $129.63 trillion in 2021, according to the Federal Reserve Payments Study. The number of noncash payments has more than tripled since 2000.
Payment type | 2021 number | 2024 number | 2024 value |
| Credit cards | 51.0 billion | 67.1 billion | $6.51 trillion |
| Debit cards (non-prepaid) | 87.8 billion | 99.3 billion | $4.34 trillion |
| Prepaid cards | 18.9 billion | 21.3 billion | $0.65 trillion |
| ACH | 36.0 billion | 39.7 billion | $104.06 trillion |
| Checks | 11.0 billion | 9.2 billion | $24.45 trillion |
Two patterns stand out. Cards dominate by number, making up more than three-quarters of noncash payments, while ACH dominates by value, at almost three-quarters of the total. And credit card payments grew faster than debit card payments for the first time in almost a decade, rising about 32% in number between 2021 and 2024 compared with about 13% for debit.
How Do Consumers Pay?
Consumers made an average of 47.3 payments a month in 2025, down slightly from 48.2 in 2024, according to the Federal Reserve’s 2026 Diary of Consumer Payment Choice. Their payment mix:
Payment method | Share of consumer payments, 2025 | Share in 2015 |
| Credit cards | About 34% | 18% |
| Debit cards | About 31% | 29% |
| Cash | About 14% | 33% |
| Other (ACH, mobile apps, checks, and more) | About 21% | About 20% (derived) |
Cards now cover about two-thirds of consumer payments, and cash about one in seven.
Businesses that drop cash risk losing the one in seven payments still made with it. Our credit card statistics roundup covers card ownership, balances, and debt in more detail.
How Have Payment Habits Changed Since 2015?
In a decade, consumer payment statistics show cards replacing cash almost point for point. Credit cards gained 16 percentage points of share between 2015 and 2025, and cash lost 19, based on the Federal Reserve diary data analyzed by Pew Research Center.
Payment method | 2015 share | 2025 share | Change |
| Credit cards | 18% | About 34% | +16 points (nearly doubled) |
| Debit cards | 29% | About 31% | +2 points |
| Cash | 33% | About 14% | −19 points (down about 58%) |
| Credit and debit combined | 47% | About 65% | +18 points |
Three shifts stand out:
- Credit took cash’s place, not debit’s. Debit’s share barely moved. Almost all the growth went to credit cards, which matches the Payments Study finding that credit card payments grew about 32% in number from 2021 to 2024, compared with about 13% for debit.
- Going without cash is now common. The share of Americans who use no cash in a typical week rose from 24% to 42%.
- Paying mostly in cash is becoming rare. The share who use cash for all or almost all purchases fell by half, from 24% to 12%.
For businesses, the shift toward credit changes costs. Credit cards usually carry higher interchange than debit, as our guide to card processing fees shows, so a customer base that has moved from cash to credit costs more to serve per sale even when total sales stay flat. Check your own credit-versus-debit split each year.
How Much Do Americans Spend on Cards?
U.S. credit, debit, and prepaid cards generated $12.498 trillion in purchase volume in 2025, up 5.0% from 2024, according to the Nilson Report. Merchants paid $198.25 billion in processing fees to accept those cards, up from $187.20 billion in 2024, about 1.6% of card volume.
Fees rose 5.9% in 2025, faster than the 5.0% growth in card spending. A settlement between Visa, Mastercard, and U.S. merchants, which received preliminary court approval in June 2026, could trim credit card interchange if it receives final approval. Our guide to credit card processing fees explains what merchants pay and how to lower it.
How Big Is the ACH Network?
The ACH Network handled 35.2 billion payments worth $93 trillion in 2025, up nearly 5% in number and almost 8% in value, according to Nacha:
- Business-to-business payments: close to 8.1 billion, up almost 10%.
- Same Day ACH:4 billion payments worth $3.9 trillion, with volume up 16.7% and value up 21.4%.
- Health care claim payments: nearly 548 million, up 7.3%.
Nacha’s count differs from the Federal Reserve’s 39.7 billion ACH payments for 2024, because the two sources cover different years and measure the network differently.
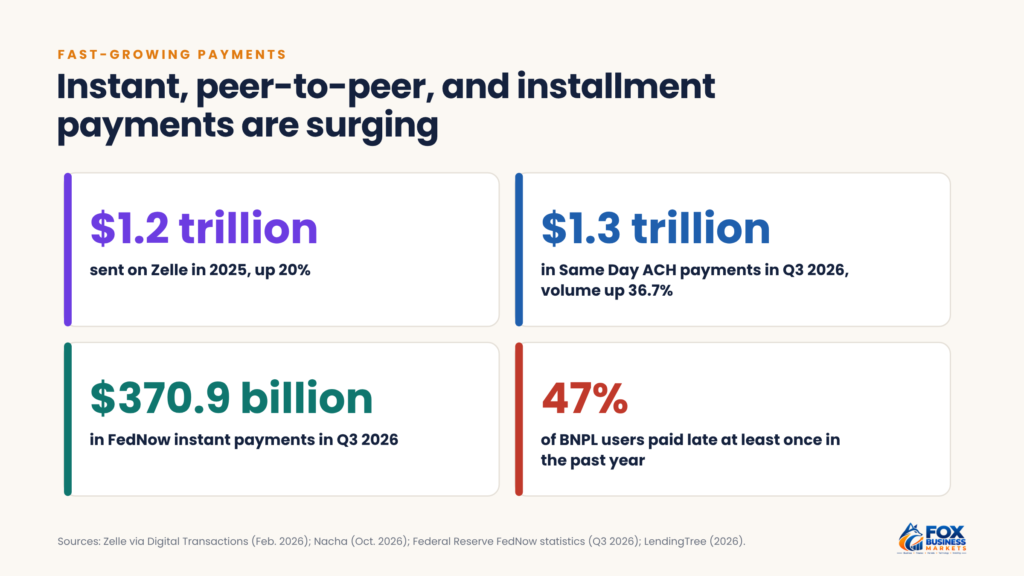
Growth continued in 2026. In the third quarter, the network handled 9.3 billion payments worth $25.6 trillion, and Same Day ACH volume jumped 36.7% from a year earlier to 470.4 million payments worth $1.3 trillion, according to Nacha’s third-quarter 2026 report. Our guide to ACH payments explains how businesses use the network.
How Do Businesses Pay Each Other?
Business-to-business (B2B) payments are moving to ACH. Nacha counted close to 8.1 billion B2B ACH payments in 2025, up almost 10%. B2B made up about 23% of all ACH Network payments, and it grew about twice as fast as the network overall, which was up nearly 5%.
Speed is the other trend. Same Day ACH handled 1.4 billion payments worth $3.9 trillion in 2025, an average of about $2,800 each. Its third-quarter 2026 volume of 470.4 million was well above the 2025 quarterly average of about 350 million.
Method | Average payment | Basis |
| ACH (all) | About $2,620 | Federal Reserve, 2024 |
| Checks | About $2,660 | Federal Reserve, 2024 |
| Same Day ACH | About $2,800 | Nacha, 2025 |
| FedNow | About $58,000 | Federal Reserve, Q3 2026 |
| Credit cards | About $97 | Federal Reserve, 2024 |
| Debit cards | About $44 | Federal Reserve, 2024 |
Checks and ACH payments are similar in average size, which makes checks the easiest payments to move to ACH. If you still pay suppliers by check, ask your largest vendors whether they accept ACH. Then ask your customers to pay you the same way.
Are Checks Still Used?
Yes, but less every year. Americans wrote 9.2 billion checks in 2024, down from 11.0 billion in 2021, a drop of about 16% in three years, according to the Federal Reserve Payments Study. Checks now make up less than 4% of noncash payments by number, down from about 5.4% in 2021.
By value, though, checks remain a major payment method. The 2024 checks were worth $24.45 trillion, about 17% of the value of all noncash payments, because many are large payments.
Paper checks also carry costs that electronic payments avoid: printing, postage, slower deposits, and the risk of theft or alteration. If you still accept checks, use your bank’s remote deposit and positive pay services, and offer customers an ACH option on every invoice.
How Fast Are Instant Payments Growing?
Instant payments, which settle in seconds at any hour, are still small compared with cards and ACH but growing quickly. The Federal Reserve’s FedNow Service settled 6.4 million payments worth about $370.9 billion in the third quarter of 2026, with an average payment of about $58,000, according to FedNow’s quarterly statistics. That one quarter equaled about 76% of FedNow’s full-year 2025 count.
- Participation: more than 1,800 banks and credit unions had joined FedNow by July 2026, up from more than 1,600 in January.
- 2025 totals: FedNow settled about 8.4 million payments worth more than $853 billion in 2025.
- Higher limits: the maximum FedNow payment rose to $10 million in November 2025, up from $1 million.
The high average payment shows that businesses are using instant payments for large, time-sensitive transfers. The Clearing House’s RTP network, a private instant-payment system, operates alongside FedNow.
How Popular Are Peer-to-Peer Payment Apps?
Zelle users sent more than $1.2 trillion in 2025, up 20% from 2024, across 4.2 billion transactions, up 16%, according to Digital Transactions, citing Zelle. In December 2025 alone, 100 million bank and credit union accounts were used to send money through Zelle.
Apps such as Venmo, PayPal, and Cash App also handle person-to-person and small-business payments. Many small businesses accept these apps for quick, low-cost payments. If you do, use business profiles where available, because some apps limit buyer protections and fees differ for business transactions.
How Is Buy Now, Pay Later Changing Payments?
Buy now, pay later (BNPL) lets shoppers split purchases into installments, often interest-free. Usage is growing, and so is financial strain among users, according to LendingTree surveys of more than 2,000 U.S. consumers in March 2026:
- 47% of BNPL borrowers paid late on at least one installment in the past year, up 13 percentage points from two years earlier.
- 29% have used BNPL for groceries, up from 14% two years earlier.
- 63% have held more than one BNPL loan at a time, including 25% who’ve held three or more.
For merchants, BNPL can raise conversion on higher-priced items, but it often costs more than card acceptance. The provider pays the merchant upfront and takes on the repayment risk.
Is Cash Disappearing?
No. A common belief is that cash is on its way out, but the data shows it’s shrinking, not vanishing. Cash still accounts for about 1 in 7 consumer payments and remained the third most-used payment method for the sixth year in a row, according to the Federal Reserve’s 2026 Diary.
ATM data tells the same story. Americans made 3.4 billion ATM cash withdrawals worth $0.72 trillion in 2024, down from 3.8 billion worth $0.76 trillion in 2021, according to the Federal Reserve Payments Study. The number of withdrawals fell about 11%, but their value fell only about 5%, so the average withdrawal rose from about $200 to about $212. People are visiting ATMs less often and taking out more cash each time.
Cash also remains important for specific groups and situations:
- Small purchases, where cash is often faster and avoids card fees.
- Budgeting, for people who prefer to spend only what they have.
- Households without bank accounts, which can’t use most digital payment methods.
- Backup, during outages, emergencies, or when digital payments fail.
Several states and cities, including New Jersey, Massachusetts, New York, Colorado, Rhode Island, Philadelphia, San Francisco, and Washington, D.C., require many businesses to accept cash. Before going cashless, check your state and local rules, and consider whether turning away cash customers costs more than handling cash.
What Do These Payment Statistics Mean for Your Business?
- Accept cards and digital wallets everywhere you sell, because cards make up about two-thirds of consumer payments.
- Watch your card costs, since total merchant fees rose about 6% in 2025. Track your effective rate monthly.
- Offer ACH for invoices and recurring billing, where costs are far lower than cards. Our guide on how to invoice shows how to add “pay by bank” options.
- Ask your bank about instant payments if you make large, time-sensitive transfers.
- Keep accepting cash unless you’ve confirmed local rules and customer impact.
- Weigh BNPL carefully, comparing higher fees against higher sales on big-ticket items.
Payment timing also shapes your cash flow. Our guide to cash flow management shows how to plan around it.
Frequently Asked Questions
How can I track payment statistics for my own business?
Most point-of-sale systems, payment processors, and accounting tools can report sales by payment method, along with the fees charged for each. Pull the report for the last 12 months and work out each method’s share of sales and its effective fee rate (fees divided by sales). Set a recurring reminder to rerun the report every quarter, so you see shifts in how your customers pay before they show up in your margins.
How often are payment statistics updated?
The Federal Reserve Payments Study is published every three years, the Diary of Consumer Payment Choice yearly, Nacha’s ACH figures quarterly and annually, FedNow’s statistics quarterly, and the Nilson Report’s fee data yearly. Each source measures different things, so numbers can differ. Note the year and source next to any statistic you quote in a business plan or pitch deck.
Is payment fraud increasing?
Payment fraud remains a major problem, especially check fraud and scams that trick people or businesses into sending money to criminals. Nacha added new fraud monitoring rules for ACH payments in 2026. Turn on your bank’s fraud alerts and verify any request to change payment details by calling a known phone number.
What is the difference between real-time payments and Same Day ACH?
Real-time payments, such as FedNow and RTP, settle individual payments in seconds, 24 hours a day, every day of the year. Same Day ACH settles batches of payments within the same business day, during set processing windows, and doesn’t run on weekends or federal holidays. Ask your bank which options it supports and what each costs before you promise customers instant payouts.
Review Your Payment Mix This Quarter
Compare how your customers pay with the national payment statistics in this roundup. Pull a report of your sales by payment method, calculate what each method costs you, and look for gaps, such as missing digital wallets, no ACH option on invoices, or high card fees on large B2B sales. Then make one change this quarter, whether that’s adding “pay by bank” to invoices, renegotiating card pricing, or enabling instant payouts. Our small business finance guide shows how payment choices fit your broader financial plan.
This article is for general information only and isn’t financial, tax, legal, or investment advice. Consider your own situation or talk to a qualified professional before making decisions.


