Debt-to-Equity Calculator: Measure D/E Ratio & Financial Leverage
The Debt-to-Equity (D/E) ratio is the definitive metric of corporate financial leverage, quantifying the exact proportion of company financing provided by debt creditors relative to equity shareholders. This calculator computes both Standard Total Debt-to-Equity and Net Debt-to-Equity, while determining critical balance sheet solvency benchmarks including the Debt-to-Assets Ratio and the Equity Multiplier. Whether evaluating debt capacity for commercial borrowing, assessing bankruptcy risk during interest rate fluctuations, or stress-testing a capital restructuring, this tool provides rigorous, institutional credit clarity.
Who it's for: Corporate treasurers, chief financial officers, commercial credit officers, equity analysts, and institutional investors auditing balance sheet risk profiles and capital structure optimality.
Why use it:
- Gauge Solvency & Default Exposure: Determine whether liabilities disproportionately outweigh shareholder capital, highlighting potential vulnerability to downturns.
- Verify Banking Covenant Compliance: Ensure debt ratios stay comfortably below maximum covenant ceilings mandated by syndicated loan and credit facility agreements.
- Optimize Weighted Average Cost of Capital (WACC): Calibrate the ideal blend of low-cost debt versus dilutive equity financing to maximize shareholder enterprise value.
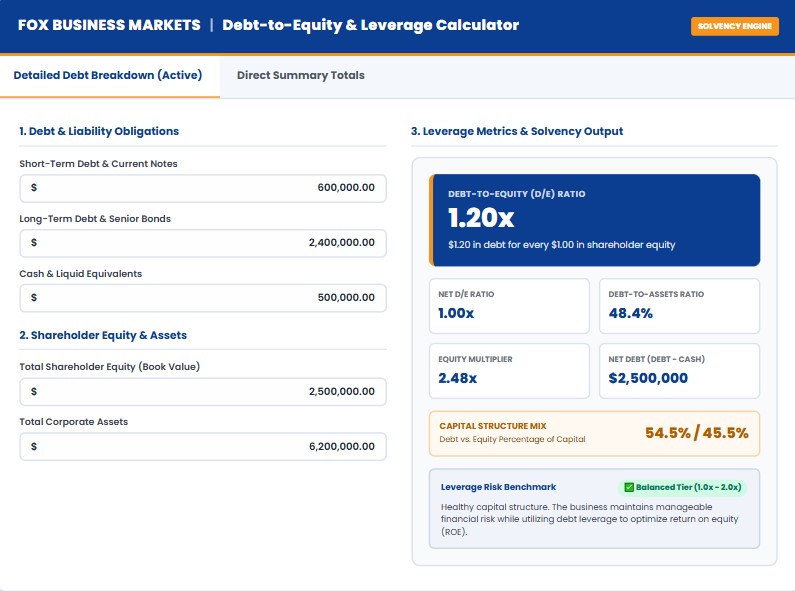
Healthy capital structure. The business maintains manageable financial risk while utilizing debt leverage to optimize return on equity (ROE).
How to Use the Debt-to-Equity & Leverage Calculator
Auditing corporate leverage requires evaluating how much of a company's asset base is financed through third-party debt liabilities versus shareholder equity. Follow these steps to measure your balance sheet risk profile:
- Select Your Calculation Mode: Choose the Detailed Debt Breakdown tab to enter itemized liabilities (short-term notes, senior long-term bonds, and liquid cash deductions). Alternatively, choose the Direct Summary Totals tab if you already possess aggregate debt and equity totals from your balance sheet.
- Input Debt Obligations: Enter short-term notes maturing within 12 months alongside long-term bank term loans, commercial mortgages, and debt securities. Use the top-bar dropdown to set your reporting currency (USD, GBP, EUR, CAD, AUD).
- Account for Liquid Cash Reserves: Enter cash and cash equivalents to calculate Net Debt-to-Equity. Deducting liquid assets reveals your true unhedged leverage position.
- Enter Book Value of Shareholder Equity: Input total equity from your balance sheet (common stock, additional paid-in capital, and cumulative retained earnings).
- Input Total Assets for Advanced Multipliers: Add total corporate assets to instantly unlock the Debt-to-Assets Ratio and the DuPont Equity Multiplier.
- Examine Solvency Benchmarks: Review the dynamic verdict card to evaluate credit risk against institutional lending covenants and sector medians.
How It Works & Core Mathematical Formulas
The Debt-to-Equity ratio demonstrates whether a company's capital structure relies predominantly on borrowed money or invested shareholder equity. Complementary leverage metrics isolate asset backing and liquid cash offsets.
Total Debt = Short-Term Debt + Long-Term Debt
Debt-to-Equity (D/E) = Total Debt / Total Shareholder Equity
2. Net Debt-to-Equity Ratio:
Net Debt = Total Debt - Cash & Cash Equivalents
Net D/E = Net Debt / Total Shareholder Equity
3. Asset Leverage & DuPont Multipliers:
Debt-to-Assets Ratio (%) = (Total Debt / Total Corporate Assets) × 100
Equity Multiplier = Total Corporate Assets / Total Shareholder Equity
Total Capital = Total Debt + Total Shareholder Equity
Debt % of Capital = (Total Debt / Total Capital) × 100
Fully Worked Numerical Example
Consider an established manufacturing enterprise preparing for commercial refinancing to expand plant capacity and purchase production equipment.
Corporate Solvency Case Study: Precision Manufacturing Corp.
- Short-Term Debt & Revolver Balance: $600,000.00
- Long-Term Senior Bank Notes: $2,400,000.00
- Cash & Marketable Securities: $500,000.00
- Total Shareholder Equity (Book Value): $2,500,000.00
- Total Corporate Assets: $6,200,000.00
Step-by-Step Mathematical Execution:
- Calculate Total Debt: $600,000 + $2,400,000 = $3,000,000.00
- Calculate Net Debt: $3,000,000 - $500,000 = $2,500,000.00
- Calculate Debt-to-Equity (D/E): $3,000,000 / $2,500,000 = 1.20x (or 1.20 : 1)
- Calculate Net D/E Ratio: $2,500,000 / $2,500,000 = 1.00x
- Calculate Debt-to-Assets: ($3,000,000 / $6,200,000) × 100 = 48.39%
- Calculate Equity Multiplier: $6,200,000 / $2,500,000 = 2.48x
- Calculate Capital Mix: Debt represents 54.55% and Equity represents 45.45% of total capital ($5,500,000).
Strategic Financial Takeaway: With a D/E ratio of 1.20x and Net D/E of 1.00x, the firm falls well within institutional safety limits (standard commercial covenants typically cap D/E at 2.0x to 2.5x). Less than half of total assets (48.4%) are encumbered by debt claims, preserving headroom for future expansion.
Industry Benchmarks Comparison Table
Acceptable D/E ratios vary substantially across business sectors depending on capital intensity, predictable operating cash flows, and collateral asset durability:
| Industry Sector | Typical D/E Ratio | Debt-to-Assets Range | Financial Leverage Profile | Underlying Leverage Driver |
|---|---|---|---|---|
| Regulated Utilities & Power | 1.8x – 3.5x | 55% – 75% | High Leverage | Guaranteed Rate Bases & Steady Cash Flows |
| Commercial Real Estate (REITs) | 1.5x – 3.0x | 50% – 70% | High Leverage | High Collateral Liquidation Value of Land/Buildings |
| Industrial & Manufacturing | 0.8x – 1.6x | 35% – 55% | Moderate Leverage | Equipment Depreciation & Cyclical Order Volumes |
| Retail & Consumer Goods | 0.6x – 1.4x | 30% – 50% | Moderate / Low | Working Capital Seasonality & Lease Commitments |
| Enterprise SaaS & Tech | 0.1x – 0.5x | 5% – 25% | Very Low (Net Cash) | Low Tangible Assets & Equity-Driven Growth |
Where to Find Your Numbers
Calculating financial leverage without distortions requires retrieving verified figures from audited corporate statements:
- Short-Term Debt: Located under Current Liabilities on the Balance Sheet. Includes revolving credit line draws, bank overdrafts, and current portions of long-term notes due within 12 months. Compare against short-term liquidity using our Working Capital Calculator.
- Long-Term Debt: Listed under Non-Current Liabilities. Includes term loans, senior unsecured notes, corporate mortgages, and debentures.
- Cash & Marketable Securities: Found at the top of Current Assets on the Balance Sheet. Used to net against debt to measure net leverage.
- Total Shareholder Equity: Found at the bottom of the Balance Sheet. Comprises common stock, additional paid-in capital (APIC), treasury stock offsets, and cumulative retained earnings. Track ownership dilution with our Business Ownership Calculator.
- Total Assets: The bottom-line balance of all tangible and intangible corporate assets, ensuring compliance with the fundamental accounting equation ($Assets = Liabilities + Equity$).
What This Calculator Can and Cannot Tell You
What This Calculator Can Tell You:
- The exact mathematical weighting of debt financing versus equity capital in your corporate structure.
- Whether your company has surplus borrowing capacity to fund growth or is nearing bank covenant ceilings.
- How vulnerable the balance sheet is to economic shocks, margin contractions, or rising interest refinancing rates.
What This Calculator Cannot Tell You:
- Cash Flow Debt Service Capacity: A company with a modest 1.0x D/E ratio can still default if its operating earnings are insufficient to service interest payments. Evaluate cash flow and enterprise multiples with our Enterprise Value Calculator.
- Off-Balance Sheet Commitments: Standard D/E does not incorporate operational supply commitments or contingent legal liabilities unless explicitly recognized as balance sheet debt.
- Operating Break-Even Sensitivity: High financial leverage magnifies risk when operating margins shrink. Verify fixed cost coverage using our Break-Even Calculator.
Related Guides and Calculators
Balance sheet leverage directly influences operational liquidity, valuation multiples, and long-term financial modeling. Explore these related calculators to complete your financial audit:
Frequently Asked Questions (FAQ)
In general corporate finance, a D/E ratio between 1.0x and 1.5x is considered balanced and healthy. A ratio under 1.0x indicates conservative management where equity outweighs debt. However, capital-intensive industries like utilities, pipelines, and real estate routinely maintain D/E ratios of 2.0x to 3.0x without distress, while asset-light technology firms typically operate below 0.5x.
Standard Debt-to-Equity (D/E) compares total gross debt directly against shareholder equity. Net Debt-to-Equity (Net D/E) subtracts cash and cash equivalents from total debt before dividing by equity ($Net\ Debt = Total\ Debt - Cash$). Net D/E provides a more accurate view of solvency because a company with $5M in debt but $4M in cash carries an effective debt burden of only $1M.
Yes, a negative D/E ratio occurs when a company has negative shareholder equity (liabilities exceed total assets). This typically happens after sustained multi-year operating losses, large non-cash asset write-downs, or aggressive debt-funded dividend recaps. A negative D/E ratio indicates extreme balance sheet distress and technical insolvency.
Financial leverage acts as an operational amplifier. When a company earns a return on its borrowed funds that exceeds the borrowing interest rate, each incremental dollar of debt increases the return generated on shareholder equity (as modeled in the DuPont formula via the Equity Multiplier). However, if earnings decline, fixed interest payments compress net margins rapidly, multiplying equity losses.
Commercial lenders and bondholders include maximum D/E ratio caps (often set at 2.0x to 2.5x) in credit agreements. Breaching this covenant constitutes a technical default, giving lenders the right to demand immediate repayment, increase interest margins, or freeze additional draws on revolving credit lines.
The Bottom Line & Authoritative References
The Debt-to-Equity ratio remains the gold standard for measuring financial risk, capital structure optimality, and corporate solvency. Striking the right balance between low-cost debt and equity financing allows companies to fund aggressive operational expansion without exposing equity holders to insolvency risk.
Authoritative Solvency Standards & Financial Methodologies:
- CFA Institute: Financial Analysis Techniques: Solvency Ratios and Capital Structure
- Corporate Finance Institute (CFI): Debt-to-Equity Ratio - Formula, Interpretation, and Industry Benchmarks
- Harvard Business Review: How Much Debt Is Right for Your Company? (Brealey, R. & Myers, S.)
- Federal Reserve Board: Financial Leverage, Corporate Debt Vulnerabilities, and Financial Stability