
Quick answer: About $9.6 trillion in currencies trades every day, making forex the world’s largest financial market. The U.S. dollar is on one side of 89% of trades, and the U.K., mostly London, handles 38% of all trading. Retail traders are a sliver of the market: U.S. retail forex accounts held just $470 million at the end of September 2026.
The global foreign exchange (FX) market handled about $9.6 trillion a day in April 2025, up 28% in three years, according to the Bank for International Settlements (BIS). That’s roughly $400 billion every hour, around the clock on weekdays.
Yet the dollar’s grip on the system is loosening in one place even as it holds firm in another. The U.S. dollar was involved in 89.2% of all trades in 2025, essentially unchanged. But its share of central bank reserves has fallen from about 70% in 2000 to 56.7% in mid-2026, according to International Monetary Fund (IMF) data. And currency markets have turned unusually calm: EUR/USD (euro/U.S. dollar) volatility in 2026 is on track to be the third lowest of any year since 2000, based on our analysis of Federal Reserve data.
This roundup collects the latest forex statistics on market size, instruments, currencies, trading centers, central bank reserves, volatility, recent currency moves, and retail trading, with sources for every figure and a closing section on what the numbers mean for you.
Forex Statistics at a Glance
- $9.6 trillion: average daily forex turnover in April 2025, up 28% from 2022 (BIS). The BIS’s December 2025 review cites about $9.5 trillion.
- 42%: share of turnover in FX swaps, the largest instrument. Spot trading made up 31%, about $3 trillion a day (BIS).
- 2%: share of trades involving the U.S. dollar. The euro was involved in 28.9% and the yen in 16.8% (BIS).
- 2%: EUR/USD’s share of global turnover, the most traded pair (BIS).
- 29%: record share of turnover involving emerging market currencies, led by the Chinese renminbi (BIS).
- 9%: share of trading handled in the U.K., about twice the U.S. share of 18.7% (calculated from BIS volumes reported by Banque de France).
- 7%: U.S. dollar share of global central bank reserves in mid-2026, down from about 70% in 2000 (IMF).
- 6%: EUR/USD’s annualized volatility in 2026 through Nov. 6, the third lowest since 2000 (Fox Business Markets analysis of Federal Reserve data).
- 4%: U.S. Dollar Index decline in 2025, its worst year since 2017 (NPR; Barchart).
- 71%: average share of retail forex and contracts for difference (CFD) accounts that lose money, across 49 brokers’ European Union (EU) and U.K. entities (BrokerRank).
- $470.5 million: total U.S. retail forex client funds on Sept. 30, 2026, held at just six dealers (Commodity Futures Trading Commission, or CFTC).
How Big Is the Forex Market?
Forex is the largest financial market in the world by trading volume. The BIS measures it every three years through its Triennial Central Bank Survey, which collects data from more than 1,100 banks and dealers in 52 jurisdictions.
Year | Average daily turnover |
| 2001 | $1.2 trillion |
| 2004 | $1.9 trillion |
| 2007 | $3.3 trillion |
| 2010 | $4.0 trillion |
| 2013 | $5.4 trillion |
| 2016 | $5.1 trillion |
| 2019 | $6.6 trillion |
| 2022 | $7.5 trillion |
| 2025 | $9.6 trillion |
April of each survey year, net of double counting. Earlier years reflect later BIS revisions.
Daily turnover has grown roughly eightfold since 2001. The only decline between surveys came in 2016. For more on how the market works, see our guide to forex trading.
Which Instruments Dominate Forex Trading?
Most forex trading isn’t the simple currency exchange many people picture. In April 2025, according to the BIS:
- FX swaps made up about 42% of turnover, or roughly $4 trillion a day. Banks, funds, and companies use them to borrow one currency against another for short periods, often overnight or for a week.
- Spot trades, which settle within two business days, made up about 31%, or roughly $3 trillion a day. This is the market most retail traders use.
- Outright forwards, options, and currency swaps made up the rest. Outright forwards, including nondeliverable forwards for currencies with capital controls, posted some of the largest gains, according to the BIS.
The BIS also found that major dealer banks matched “well over 80%” of their clients’ spot trades internally, without sending them to outside platforms.
Which Currencies and Pairs Are Traded Most?
The U.S. dollar dominates currency trading, but emerging market currencies are gaining.
Currency | Share of global turnover, 2025 |
| U.S. dollar | 89.2% |
| Euro | 28.9% |
| Japanese yen | 16.8% |
| British pound | 10.2% |
| Chinese renminbi | 8.5% |
| Swiss franc | 6.4% |
| Australian dollar | About 6% |
| Canadian dollar | About 6% |
Shares add up to 200% because every trade involves two currencies. Source: BIS Triennial Central Bank Survey 2025.
Among pairs, EUR/USD led with 21.2% of turnover, followed by USD/JPY (U.S. dollar/Japanese yen) at 14.3%. USD/CNY, the dollar against the Chinese renminbi, rose to 8.1% from 6.6% in 2022, passing GBP/USD (British pound/U.S. dollar), which fell to 7.6% from 9.5%.
Emerging market currencies as a group reached a record 29% of turnover, according to the BIS’s December 2025 review of the survey. Our guide to currency pairs explains how majors, crosses, and exotics differ.
Where Does Forex Trading Happen?
A handful of financial centers handle most trading. In April 2025, based on our calculations from BIS volumes compiled by the Banque de France:
- United Kingdom:9%, down slightly from 38.1% in 2022
- United States:7%, down from 19.4%
- Singapore:9%, up from 9.4%, after trading jumped 60%
- Hong Kong:1%
- Japan:5%, down from 4.4%
- Germany:1%, after trading more than doubled
- Switzerland:0%
Singapore has strengthened its position as Asia’s largest forex hub, while Japan’s share has slipped even though its trading held steady. London’s dominance shapes when the market is busiest, as our guide to forex trading hours explains.
Who Trades Forex?
Banks and other financial institutions account for nearly all forex trading. According to the BIS, in April 2025:
- 46% of turnover was between reporting dealers, the large banks that make markets
- 50% involved other financial institutions, such as smaller banks, hedge funds, pension funds, insurers, and proprietary trading firms
- 5% involved nonfinancial customers, mostly companies converting sales and costs
Retail traders don’t appear as their own category. Their orders reach the market through brokers and banks, and the money involved is small compared with institutional flows. In the U.S., total retail forex client funds stood at $470.5 million at the end of September 2026, according to the CFTC’s monthly financial data. That’s tiny next to global turnover, although leverage lets retail traders trade far more than they deposit.
How Much Do Central Banks Hold in Each Currency?
Central banks hold foreign currency reserves to defend their own currencies and pay for imports. The IMF tracks the mix through its Currency Composition of Official Foreign Exchange Reserves (COFER) data.
Year (end of period) | U.S. dollar share | Euro share |
| 2000 | 69.7% | 17.5% |
| 2005 | 64.9% | 21.9% |
| 2010 | 61.9% | 22.9% |
| 2015 | 64.2% | 19.4% |
| 2020 | 59.5% | 20.6% |
| 2024 | 58.4% | 18.9% |
| 2025 | 56.5% | 20.4% |
| June 2026 | 56.7% | 20.6% |
Shares of total reserves after the IMF’s December 2025 data revision. Source: IMF COFER, compiled by DaveManuel.com.
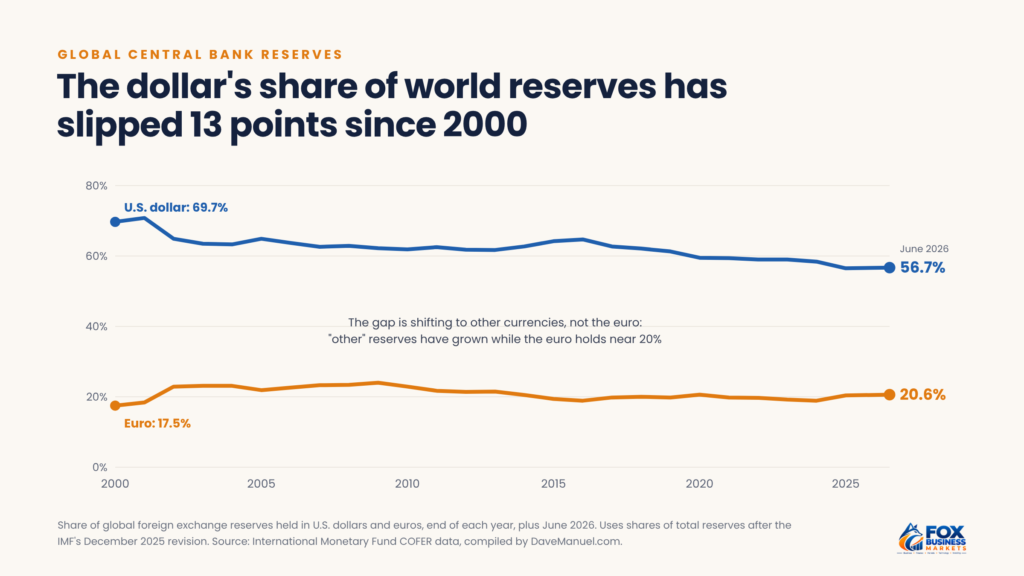
U.S. dollar and euro shares of global central bank reserves from 2000 to 2026
The dollar’s share has drifted down by about 13 percentage points since 2000, but no single rival has replaced it. The euro’s share has stayed near 20%. Most of the shift has gone to smaller “nontraditional” currencies such as the Canadian and Australian dollars, the Chinese renminbi, and the South Korean won.
Part of the quarterly change is mechanical. When the dollar weakens, reserves held in other currencies are worth more in dollar terms, which lowers the dollar’s share even if central banks don’t trade. The IMF has analyzed this valuation effect separately in its reviews of the data.
How Volatile Are Currencies?
Currencies usually move less than stocks, but their volatility swings widely over time. We measured the annualized volatility of three major pairs over rolling three-month periods, using daily Federal Reserve noon rates from 2000 through Nov. 6, 2026.
Pair | Average yearly volatility, 2000–2025 | 2026 through Nov. 6 | Highest three-month reading |
| EUR/USD | 8.8% | 5.6% | 22.7% (January 2009) |
| USD/JPY | 9.6% | 8.1% | 22.2% (December 2008) |
| GBP/USD | 8.9% | 6.3% | 26.3% (January 2009) |
Annualized standard deviation of daily changes. Source: Federal Reserve H.10 data via the St. Louis Fed’s Federal Reserve Economic Data (FRED); Fox Business Markets analysis.
Our analysis has limits. It covers only three major pairs and uses one daily noon quote from New York, so it misses intraday swings such as the 2016 pound flash crash. The 2026 figure covers a partial year and could change before Dec. 31, and past volatility doesn’t predict future moves.
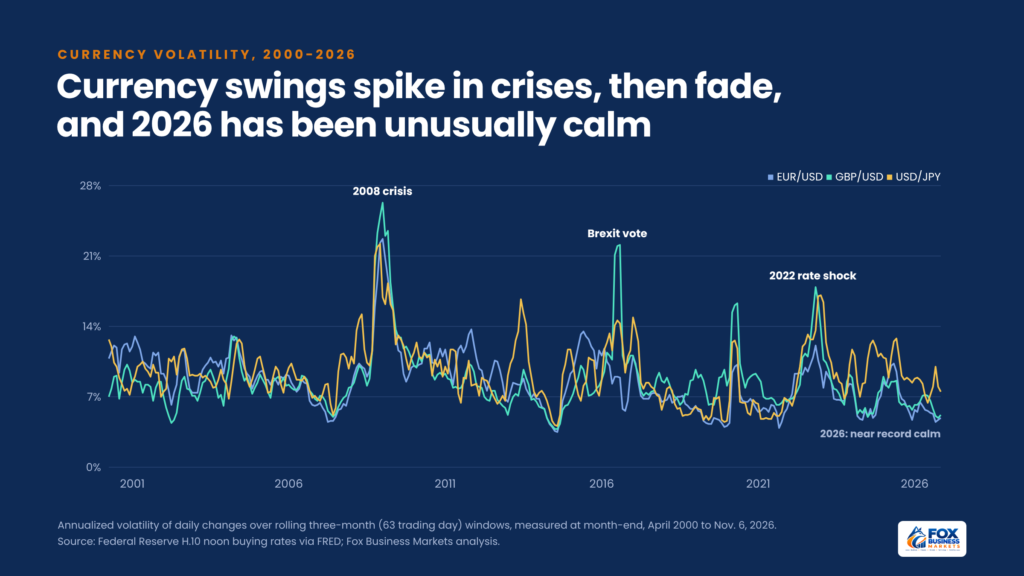
Rolling three-month volatility of EUR/USD, USD/JPY and GBP/USD from 2000 to 2026
Three periods stand out:
- The 2008 financial crisis. Volatility in all three pairs peaked around the turn of 2009, at 22% to 26%.
- The 2016 Brexit vote. GBP/USD volatility jumped above 21% after the U.K. voted to leave the European Union in June 2016.
- 2022’s rate shock. As the Federal Reserve raised rates quickly, USD/JPY volatility climbed to about 17% and the pound hit a record low.
In 2026, EUR/USD and GBP/USD are on track for their third-calmest years since 2000. USD/JPY has been livelier, in a year that included Japan’s record currency intervention.
How Have Major Currencies Moved in 2025 and 2026?
The past two years brought large swings for the dollar:
- 2025: The U.S. Dollar Index, which tracks the dollar against six major currencies, fell more than 9% (about 9.4% by most measures), its worst year since 2017, according to NPR.
- 2026 so far: The dollar has partly recovered. The index rose about 3.7% from its 2025 close through Oct. 30.
- EUR/USD: down about 5.0% in 2026 through Nov. 6, to 1.1154 from 1.1736.
- USD/JPY: up about 0.9%, to 158.23, after the yen fell to about 164 per dollar in July.
- Japan’s intervention: Japan spent a record ¥15.4 trillion, about $96.5 billion, supporting the yen from late July to late August 2026, according to BNN Bloomberg. That followed earlier interventions in April and May.
What Were the Biggest Forex Shocks in Recent Decades?
Calm stretches in currency markets have repeatedly ended in sudden, record-setting moves. Some of the most significant:
| Date | Event | What happened |
| Sept. 16, 1992 | Black Wednesday | The U.K. pulled the pound out of Europe’s Exchange Rate Mechanism after failing to defend it, Speculator George Soros’s fund reportedly made about $1 billion betting against the pound. |
| Late 2008 | Global financial crisis | Major pair volatility roughly doubled or tripled, and the yen surged as investors unwound carry trades. |
| Jan. 15, 2015 | Swiss franc shock | The Swiss National Bank dropped its cap on the franc, which soared as much as 41% against the euro in a single day. |
| June 24, 2016 | Brexit vote | The pound fell to its lowest level against the dollar since 1985 after the U.K. voted to leave the European Union. |
| Oct. 7, 2016 | Pound flash crash | The pound plunged about 6% within minutes during thin Asian trading, then recovered much of the drop. |
| Jan. 3, 2019 | Yen flash event | The yen jumped sharply against several currencies within minutes during a Japanese holiday. |
| Sept. 26, 2022 | U.K. budget crisis | The pound hit a record low of about $1.03 after the government announced large unfunded tax cuts. |
| Aug. 5, 2024 | Carry trade unwind | A rush out of yen-funded trades helped drive Japan’s Nikkei index to its worst day since 1987. |
| April–August 2026 | Yen intervention | Japan made record yen purchases after the currency slid toward 164 per dollar. |
These episodes share a pattern: many happened when markets were thin, positions were crowded, or a policy that traders had relied on suddenly changed. They’re a reminder that today’s low volatility readings say little about tomorrow’s risk.
What Do Retail Forex Statistics Show?
Retail forex trading is small, concentrated, and usually unprofitable for traders.
U.S. dealers are few and concentrated. Only six firms reported retail forex client funds to the CFTC at the end of September 2026:
Dealer | Retail forex client funds, Sept. 30, 2026 | Share |
| Gain Capital Group (FOREX.com) | $201.0 million | 42.7% |
| OANDA | $134.4 million | 28.6% |
| Charles Schwab Futures and Forex | $55.6 million | 11.8% |
| TastyFX | $49.9 million | 10.6% |
| Interactive Brokers | $27.1 million | 5.8% |
| Trading.com Markets | $2.5 million | 0.5% |
| Total | $470.5 million | 100% |
Source: CFTC financial data for futures commission merchants and retail foreign exchange dealers.
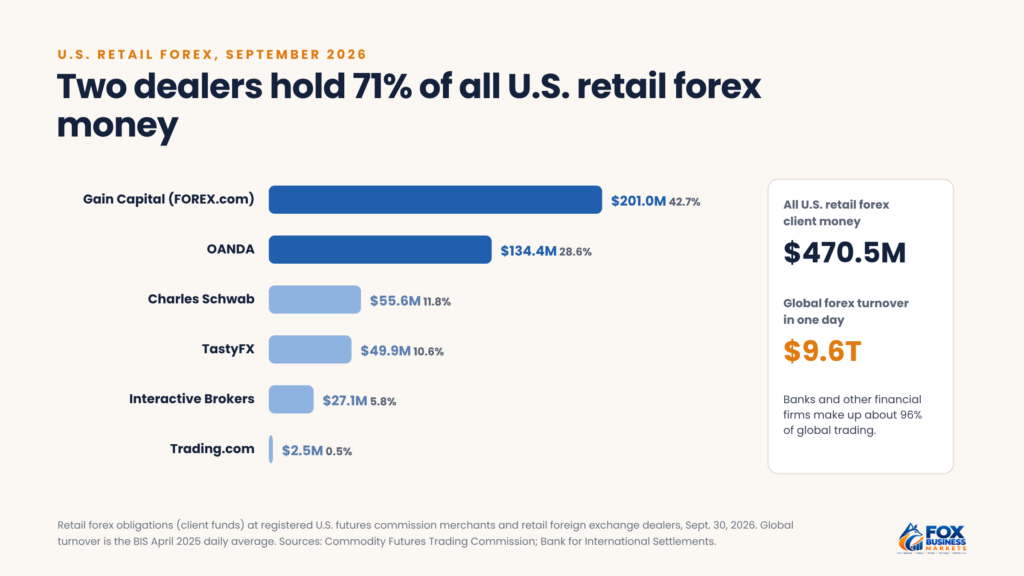
U.S. retail forex client funds by dealer in September 2026
The top two dealers hold about 71% of all U.S. retail forex money. Interest in U.S. retail forex has been flat. Client funds fell for three straight months to $462.3 million in June 2026, the lowest since at least September 2023, according to Finance Magnates, and have hovered near $470 million since.
Most retail traders lose money. Brokers regulated in the EU and U.K. must disclose what share of retail accounts lose money. Across 49 brokers’ disclosures, the average was 71%, with a range of 51% to 81%, according to a 2026 BrokerRank review. These figures include CFDs on other assets, and methods vary by broker, but at every broker in the sample, most accounts lost money. Comparable U.S. figures aren’t published in the same way.
Leverage is a major reason. Our guide to forex leverage shows how often high leverage wipes out accounts using 10 years of real exchange rates.
Is It a Myth That Retail Traders Drive the Forex Market?
Yes. Social media and broker advertising can make forex look like a retail trader’s market, but the numbers show otherwise.
Global turnover runs about $9.6 trillion a day, and banks and other financial institutions account for about 96% of it. All U.S. retail forex accounts combined hold less than half a billion dollars. Even worldwide, retail trading is a small fraction of the market, and retail orders typically pass through dealers that hedge or offset them.
The scale gap has consequences for traders, too. Prices are set mostly by large banks, asset managers, and central banks responding to interest rates, trade flows, and economic data. Individual traders are price takers, competing against firms with faster systems, better pricing, and far more information.
What Do These Forex Statistics Mean for You?
The numbers point to a few practical takeaways:
- The dollar still dominates trading. Even as its share of reserves slips, the dollar is on one side of nearly 9 in 10 trades, so U.S. economic data and Federal Reserve decisions move most major pairs.
- Calm markets don’t last. EUR/USD and GBP/USD volatility in 2026 is near historic lows, but past calm periods have ended abruptly, as the shocks table above shows.
- Retail trading carries steep odds. With most retail accounts losing money, treat forex trading as high-risk speculation, not an investment strategy.
- Currency moves affect regular investors too. A falling dollar raises the value of foreign stocks in a U.S. portfolio, and a rising dollar does the reverse.
- Travelers feel the swings. A 5% move in EUR/USD changes what a trip to Europe costs. Our guide to foreign currency exchange covers how to get better rates.
For broader market numbers, see our stock market statistics and investing statistics.
Frequently Asked Questions
Why do sources give different sizes for the forex market?
Figures depend on how trades are counted. The BIS’s headline number removes double counting between dealers, while totals reported by individual countries can count the same trade twice, which produces a larger “gross” figure. Older articles may also quote earlier surveys. Tip: Check whether a figure is net or gross, and which survey year it comes from.
Which currency has the highest value?
The Kuwaiti dinar is usually the highest-valued currency per unit, worth more than $3. A high unit value doesn’t make a currency stronger or more important; the dollar, euro, and yen dominate trading. Tip: Judge currencies by trading volume and stability, not by how many dollars one unit buys.
Is the forex market bigger than the stock market?
By daily trading volume, yes, by a wide margin. By total value, stocks are larger: SIFMA put global stock market value at $157.8 trillion at the end of 2025, while forex has no comparable “market value” because currencies are exchanged, not owned as shares. Tip: Compare markets using the same measure, either trading volume or total value.
Do forex statistics include cryptocurrencies?
No. BIS forex statistics cover government-issued currencies traded over the counter. Bitcoin and other crypto assets aren’t included, though stablecoins tied to the dollar are a growing area of study. Tip: Treat crypto trading data separately, since it’s measured and regulated differently.
Use These Forex Statistics to Set Realistic Expectations
Forex is the deepest, most liquid market in the world, dominated by banks and the U.S. dollar. Turnover keeps growing, emerging market currencies are gaining ground, and the dollar’s role in reserves is slowly shrinking. Retail traders remain a tiny, mostly unprofitable slice of the market.
Revisit these figures as new data arrives, and let them guide how much risk, if any, you take in currency trading.
This article is for general information only and isn’t financial, tax, legal, or investment advice. Consider your own situation or talk to a qualified professional before making decisions.

